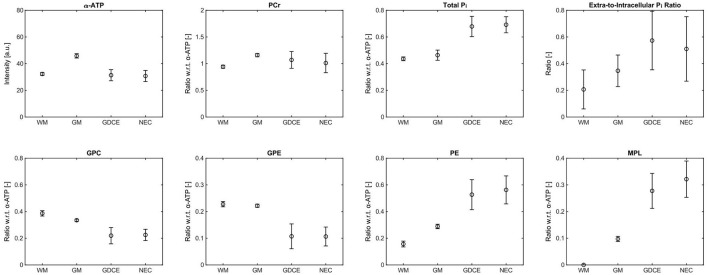
Figure 5.
Representative ROI analysis of selected metabolite intensities from the patient with high-grade glioma (glioblastoma) shown in Figures 3, 4, given as mean (circles) ± standard deviation (bars). Only the α-ATP intensities are given in arbitrary units, and subject to the coil sensitivity profile; all other metabolites are quantified as ratios with respect to the α-ATP intensity. Number of voxels n in each ROI: nWM = 8, nGM = 8, nGDCE = 173, nNEC = 69.

