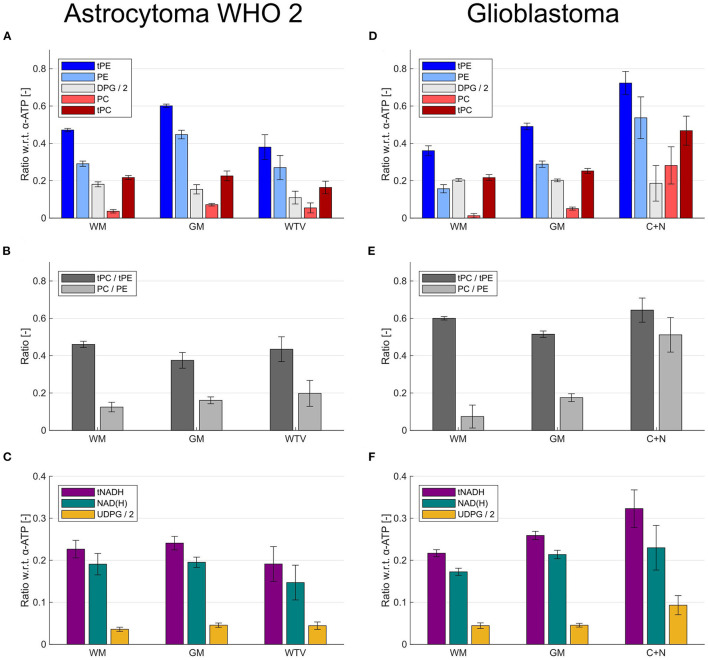
Figure 6.
Bar plots illustrating the effects of the extended modeling on the quantification results within different ROIs (healthy and tumor tissues) from the patient with low-grade glioma (astrocytoma WHO 2) shown in Figure 2 (A–C) and the patient with high-grade glioma (glioblastoma) shown in Figures 3 and 4 (D–F). (A,D) Effect of DPG inclusion on the quantified intensities of PC and PE. (B,E) Effect of DPG inclusion on the ratios derived from PC and PE. (C,F) Effect of UDPG inclusion on the quantified intensities of NAD(H). The metabolites are quantified as ratios with respect to the α-ATP intensity.

