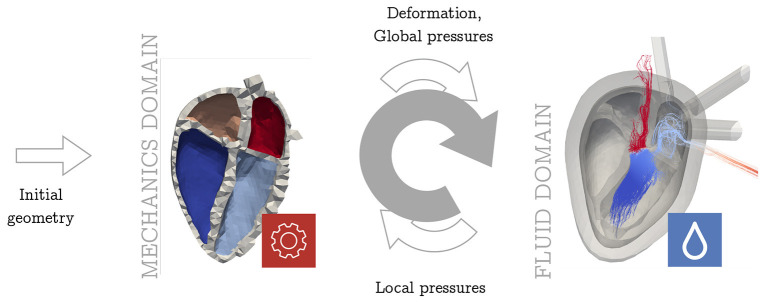
Figure 3.
Overview of coupling procedure. The arrows denote the flow of information between the two domains. The upper arrow shows the unidirectional information flow from the mechanical domain to the fluid solver as it was implemented before [e.g., Daub et al. (28)]. Now the lower arrow takes into account the retrograde effect from fluid dynamics in the mechanical simulation. This sums up to an iterative sequential procedure (gray arrow). Both—in the mechanics and in the fluid domain—several full heart beats are simulated before handing over the data to the other domain.

