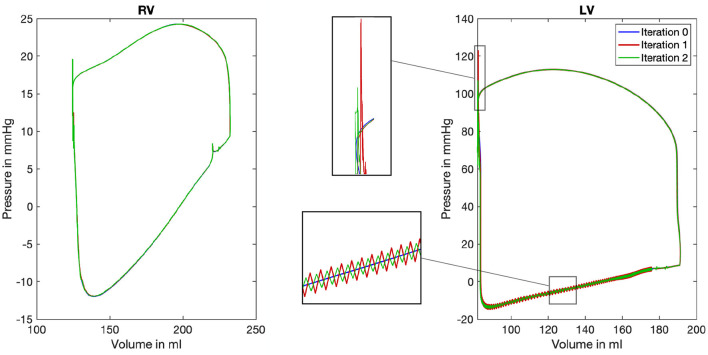
Figure 9.
Pressure-volume loop for the right (RV) and left (LV) ventricle. Color coded are the three iterations of the mechanical solver while the first iteration depicts the limit cycle after nine iterations of the mechanical solver (mechanical simulation 0, blue color). For the LV, two characteristic areas are shown enlarged in the center of the figure to highlight the differences between the three iterations.

