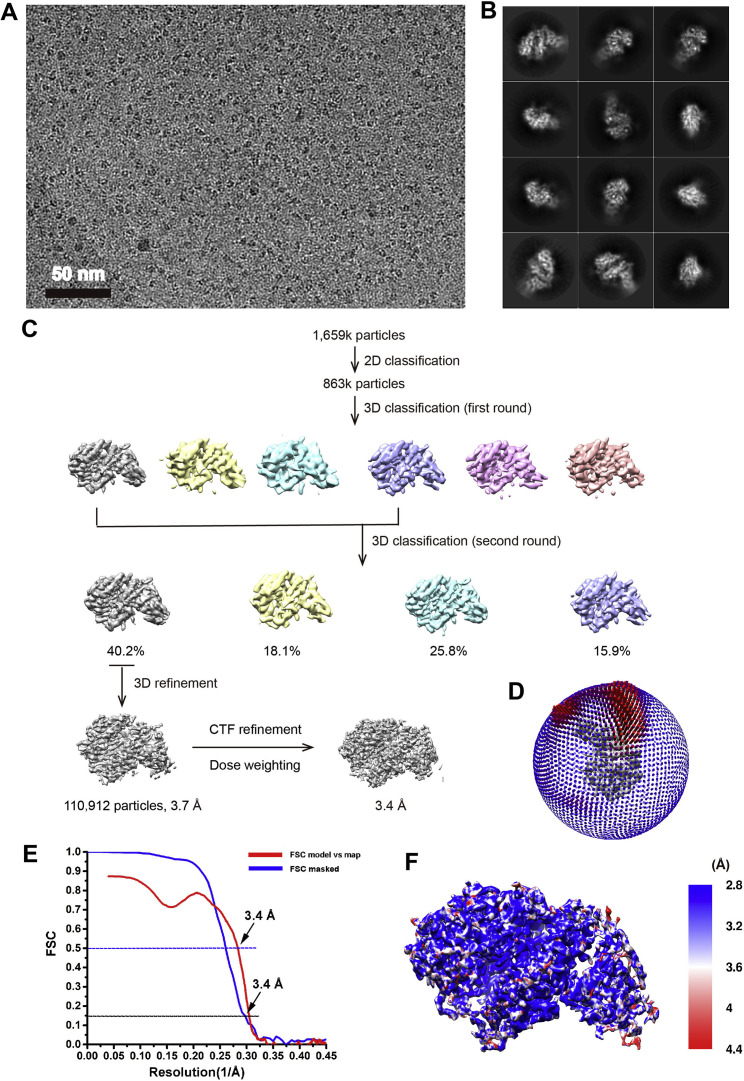
Figure S3.
Cryo-EM structrual analysis of hACE2-omicron RBD, Related to Figure 3
(A) A representative cryo-EM micrograph of hACE2-Omicron RBD. Scale bar, 50 nm. (B) 2D class average images of hACE2-Omicron RBD. (C) A brief workflow of cryo-EM image processing and reconstruction. (D) Euler angle distribution of the final reconstruction. (E) The FSC curve for the reconstruction. (F) Local resolution distribution for the density map of hACE2-Omicron RBD.

