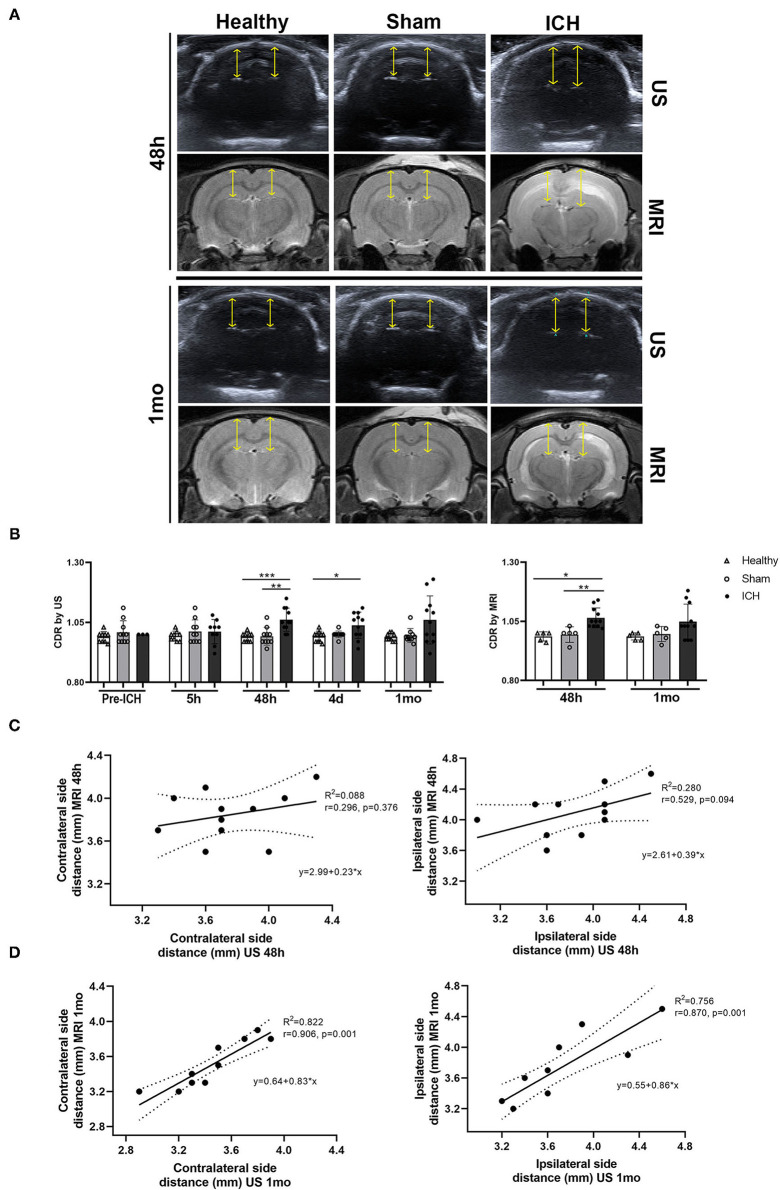
Figure 3.
(A) Representative images of the subarachnoid cisterns identified by B-mode ultrasound and MRI (T2) in the different experimental groups at 48 h and 1 mo after ICH induction. Yellow arrows indicate the measured distance. (B) Quantification of the subarachnoid cisterns to dura mater distance ratio (CDR) between the different experimental groups by B-mode ultrasound and MRI. (C,D) Representative graphs of the correlation between B-mode ultrasound and MRI in the subarachnoid cisterns to dura mater distance on both the contralateral (left) and ipsilateral (right) sides at 48 h and 1 mo after ICH induction. Data are shown as mean ± SD. *p < 0.05; **p < 0.01; ***p < 0.001. ICH, intracerebral hemorrhage; MRI, magnetic resonance imaging; US, B-mode ultrasound.

