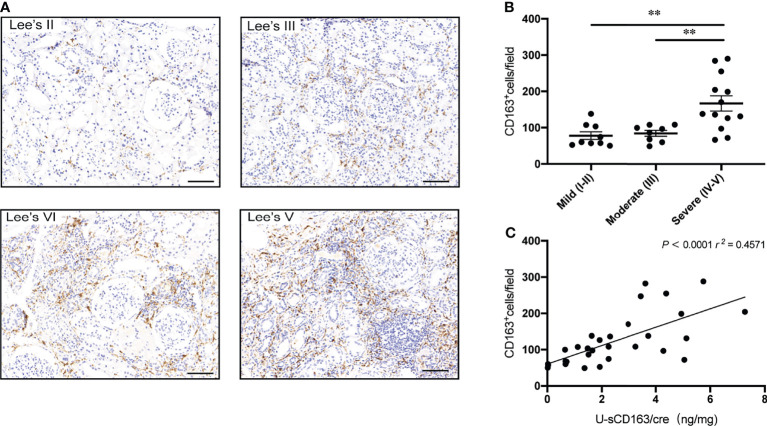
Figure 3.
Urinary sCD163 levels are correlated with tubulointerstitial CD163+ macrophage infiltration. (A) CD163+ macrophages in IgAN classified according to Lee’s pathological grade. Bar: 50 µm. (B) Quantitative analysis of CD163+ cell counts in tubulointerstitial lesions from IgAN patients assigned different Lee’s pathological grades. **P<0.001. (C) Correlation between tubulointerstitial CD163+ cell count and u-sCD163 levels; each dot represents a value from an individual patient and the group mean is shown as a horizontal bar. Coefficients of determination (r 2) and P-values are shown.

