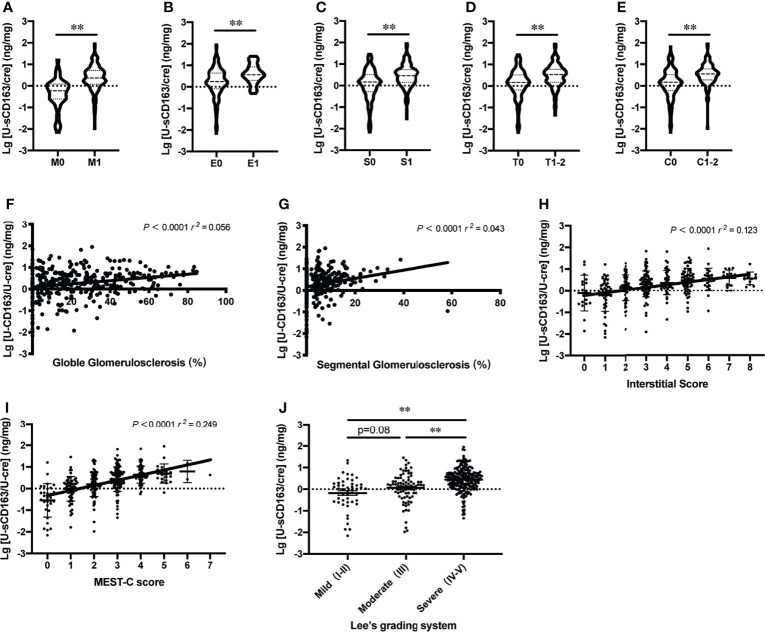
Figure 4.
Urinary sCD163 levels reflect patient histology. (A–E) Association between u-sCD163 levels in IgAN patients with Oxford Classification. **P<0.001. (F) Correlation between u-sCD163 levels and global glomerulosclerosis. (G) Correlation between u-sCD163 levels and segmental glomerulosclerosis. (H) Correlation between u-sCD163 levels and interstitial score. (I) Correlation between u-sCD163 levels and MEST-C score; each dot represents a value from an individual patient Coefficients of determination (r 2) and P-values are shown. (J) Quantitative analysis of u-sCD163 levels in IgAN patients with differing Lee’s pathological grades. **P<0.001.

