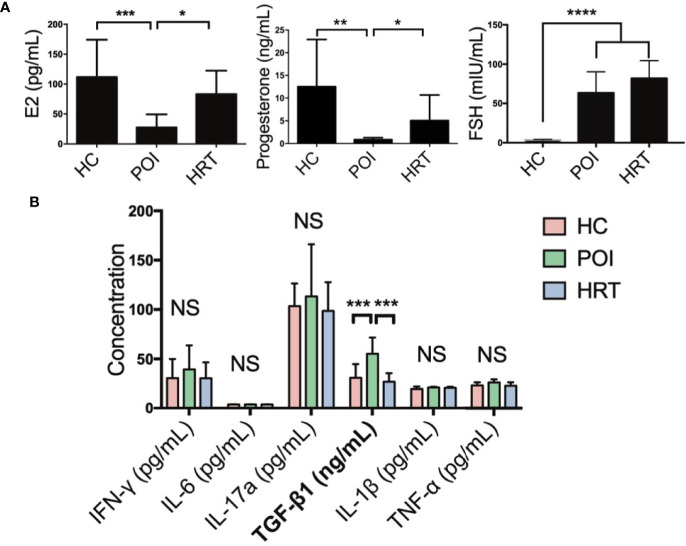
Figure 2.
Serum hormone and cytokine levels in the three study groups. (A) Serum levels of E2, progesterone, and FSH in the three study groups. (B) Serum cytokine levels in the three study groups were compared using one-way analysis of variance with GraphPad Prism 6. Data are represented as mean ± SEM. n = 10 in each group, *P < 0.05, **P < 0.01, ***P < 0.001, ****P < 0.0001, NS, not significant.

