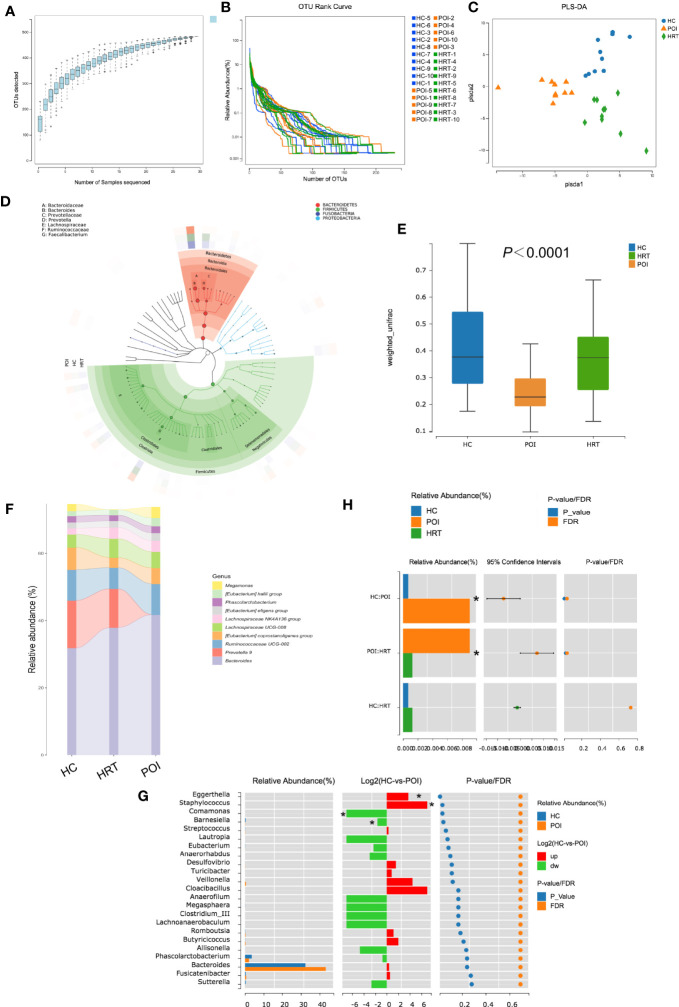
Figure 3.
Alterations in gut microbial profiles in POI patients with or without HRT. (A) Operational taxonomic unit (OTU) accumulation curve. The horizontal coordinate represents the number of samples, and the vertical coordinate represents the number of OTUs (i.e., the number of genera detected). (B) OTU rank curve of each sample (blue: HCs; orange: POI patients; green: POI patients treated with HRT). The abscissa indicates the order of OTU abundance, and the ordinate indicates OTU abundance. (C) Partial least squares discriminant analysis (PLS-DA) of data obtained from the three groups showed grouped discrimination. (D) Evolutionary clade tree constructed based on the phylum, class, order, family, and genus (the 50 most abundant were selected). The clade tree was constructed from inside to outside, with each circle representing a level in the order phylum, class, order, family, and genus. Different phyla are colored differently, and the higher the number of nodes in the branching tree, the higher the abundance of the genus. The outer rings indicate abundance maps, and each ring represents a group of samples (one sample), and each group of samples corresponds to a color, the shade of which varies with the abundance of the genus. (E) Box plot of differences in beta diversity of the gut microbiota among the three study groups (n = 10/group). (F) Sankeyplot of highly abundant genera in the three study groups (sorted by the total mean abundance of each group). (G) Wilcoxon test of genus differences between healthy control and POI groups. A bar chart of the relative abundances in each group is shown on the left. The middle panel shows the log2 value of the average relative abundance ratio of the same species in the two groups. The panel on the right shows p values and false discovery rate values obtained by the Wilcoxon test, *P < 0.05. (H) Wilcoxon test of differences in the genus Eggerthella among the three groups, *P < 0.05.

