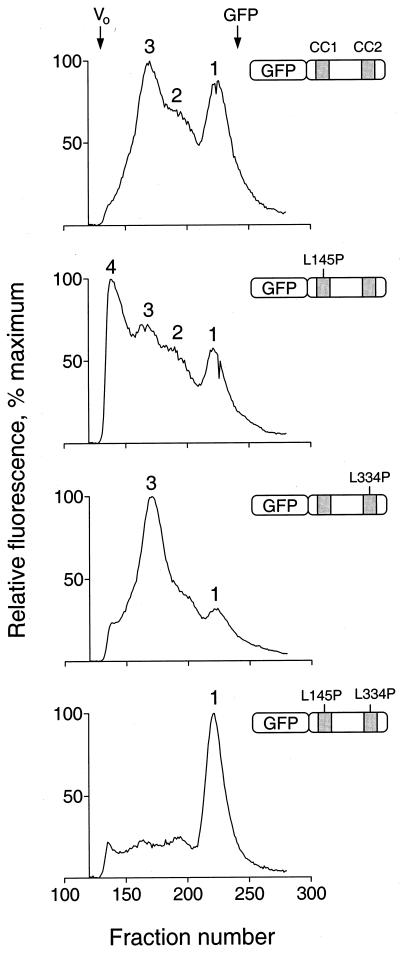
FIG. 10.
Analysis of N-terminal-Fes–GFP fusion proteins by gel filtration. Recombinant fusion proteins of GFP and Fes N-terminal amino acids encoding the CC1 and CC2 domains as well as the intervening sequence were expressed in Sf-9 cells. Cells were lysed by sonication, and lysates were clarified by ultracentrifugation and applied to a Sephacryl S-300 column. Fractions (0.25 ml) were collected in 96-well plates and analyzed for fluorescence using a microplate reader. Four fusion proteins were examined, and the resulting fluorescence elution profiles are shown together with an illustration of each protein. From top to bottom these include wild-type GFP-Fes CC1+2, the CC1 point mutant (L145P) protein, the CC2 point mutant (L334P) protein, and the double mutant protein. The void volume was determined independently using blue dextran, which eluted as a single peak at the position indicated as Vo (fraction 134). All fractions that appeared before the blue dextran peak were devoid of fluorescence and are omitted for clarity. Unfused GFP was also run as a control; it eluted as a single symmetrical peak, the position of which is indicated at the top (fraction 242). The following standards, with their molecular masses and elution positions noted, were also run: thyroglobulin, 634 kDa, fraction 149; ferritin, 439 kDa, fraction 165; catalase, 200 kDa, fraction 185; aldolase, 178 kDa, fraction 189; albumin, 62 kDa, fraction 202; ovalbumin, 48 kDa, fraction 207; and chymotrypsinogen A, 21 kDa, fraction 246. The entire experiment was repeated twice and produced the same pattern of fluorescent peaks for each protein. Note that the absolute levels of fluorescence varied less than twofold among the four fusion proteins.

