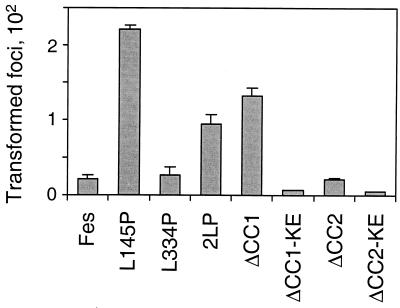
FIG. 5.
Quantitative comparison of GFP-Fes coiled-coil mutant protein transforming activities. Each of the GFP-Fes proteins illustrated in Fig. 2 was tested for focus-forming activity as described in Materials and Methods and the legend to Fig. 4. Foci were visualized by Wright-Giemsa staining and counted using a Bio-Rad model GS-710 scanning densitometer and colony-counting software. Foci from three independent cultures were counted; the bar graph shows average values ± standard deviations. KE, kinase-inactive form.

