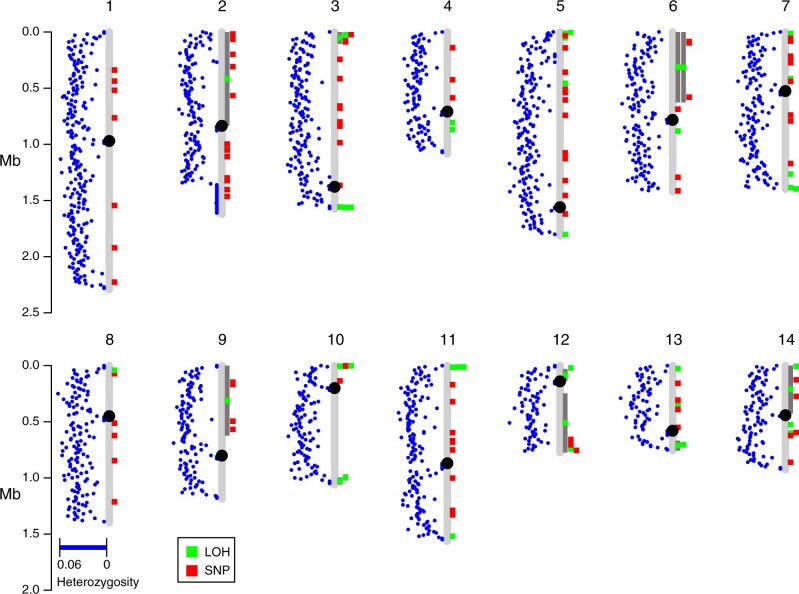
Figure 7.
Locations of mitotic recombination breakpoints are nonrandom across the genome. Blue dots indicate the average heterozygosity in 10 kb windows between C. neoformans and C. deneoformans parental genomes that passed our filtering strategies. Green boxes indicate locations of LOH events, and when accompanied by dark gray bars they indicate longer LOH tracts.

