
Figure 2.
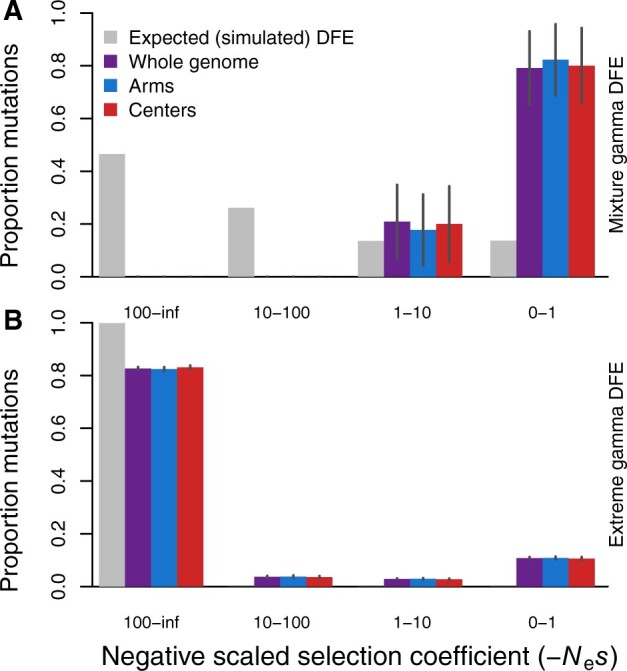
Distributions of deleterious fitness effects for simulations mimicking C. elegans genome structure and selfing reproductive mode (99.9% selfing). (A) The inferred DFEs for deleterious mutations (colored bars) from simulations with an input DFE (gray bars) of a mixture gamma distribution (β = 0.3 for 95% mutations with mean s = −0.001 and h = 0.3 plus 5% with mean s = −0.01 and h = 0.2). (B) Inferred DFEs for a more extreme, deleterious gamma distribution of mutational input (β = 2.13, mean s = −0.161, h = 0.3), similar to that of the inferred DFE from the empirical data. Larger values of −Nes are more deleterious; simulation census size N = 500,000; selfing rate 99.9%; SFS are averaged over generations 4N, 4.5N, and 5N. All estimated parameters of the inferred DFE are listed in Supplementary Table S2. Error bars indicate 95% confidence intervals.