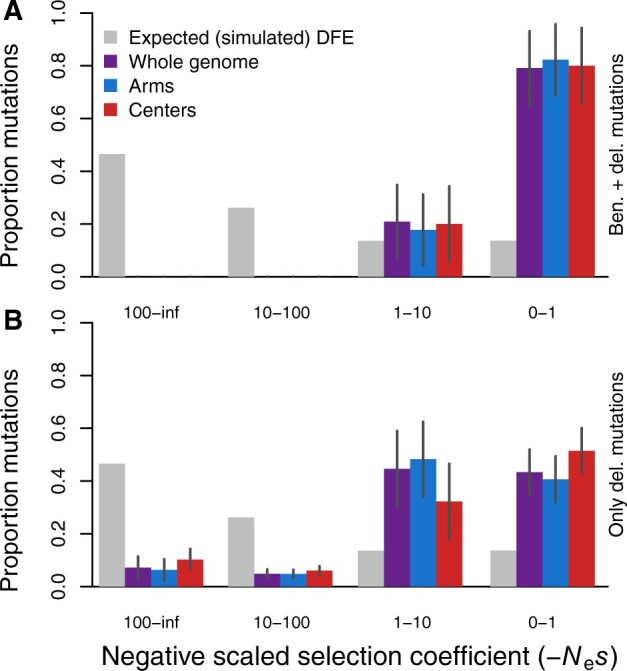
Figure 6.

The DFE inferred from simulations with both deleterious and beneficial mutations (A, as in Figure 2A), or with deleterious mutations only (B). Simulation parameters as in Figure 2. SFS are averaged over generations 4N, 4.5N, and 5N. All estimated parameters of the inferred DFE are listed in Supplementary Table S2. Error bars indicate 95% confidence intervals.
