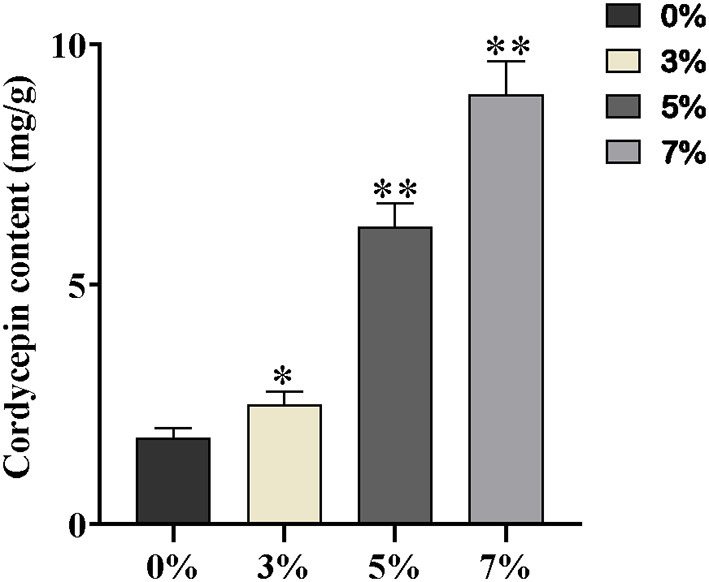
Figure 2.

The contents of cordycepin with mg/g dry weight 0, 3, 5, and 7% are equivalent to the control, slight, moderate, and severe salt treatment, respectively. Asterisks indicate statistically significant differences between groups (Student's t-test): * and ** indicating significance level was accepted at P ≤ 0.05 and P < 0.01, respectively, as compared to control.
