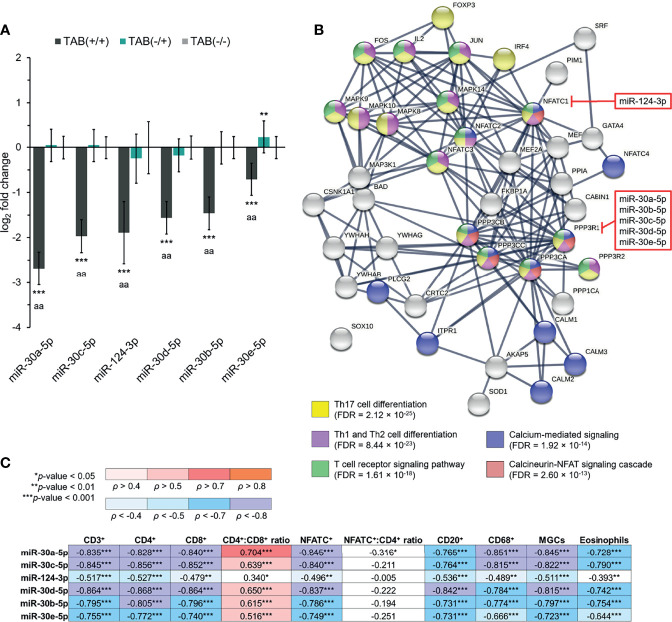
Figure 3.
The miR-30 family and miR-124 in relation to the CaN/NFAT signaling pathway in GCA. (A) Expression of miR-30 family members and miR-124-3p in TAB(+/+) [n = 30], TAB(-/+) [n = 16] and TAB(-/-) [n = 22] groups. The bars represent the means of log2 fold change values ± S.D. Data were evaluated using the Mann-Whitney U test. An asterisk indicates significance to the TAB(-/-) group (**p < 0.01; ***p < 0.001) and the letter a the significance between the TAB(+/+) and TAB(-/+) groups (aa p < 0.001). (B) STRING association network and Gene Ontology biological process annotation of top predicted functional partners of the CaN (PPP3CA, PPP3CB, PPP3CC, PPP3R1, PPP3R2) and NFAT (NFATC1, NFATC2, NFATC3, NFATC4) family members, involved in the CaN/NFAT signaling pathway. Individual proteins and protein–protein interactions with the highest confidence score (0.900) are presented. miRNAs predicted to target the PPP3R1 and NFATC1 genes are indicated in red squares. (C) Association (Spearman’s ρ correlation coefficients) between miRNA expression levels and evaluated histopathological parameters in TABs from GCA patients (n = 46). A p-value of < 0.05 was considered statistically significant in all cases. FDR, false discovery rate.

