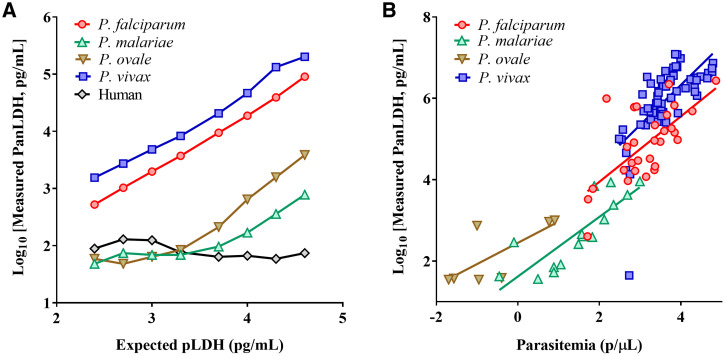
Figure 1.
Binding reactivity of recombinant or native pLDH proteins to PanLDH spot. (A) Expected concentration vs. measured concentration of recombinant pLDH and human LDH proteins. Depicted are line charts including eight data points generated with 2-fold serial dilutions of pLDH and human LDH proteins. (B) Scatter plots and best fit lines between parasite density and PanLDH level in clinical blood samples estimated by microscopy or qPCR, and the 5-Plex, respectively. Any samples with P. malariae, P. ovale, or P. vivax infections, which had no available data for parasite density, were excluded from analysis. Pearson correlation coefficient was calculated using GraphPad Prism. This figure appears in color at www.ajtmh.org.

