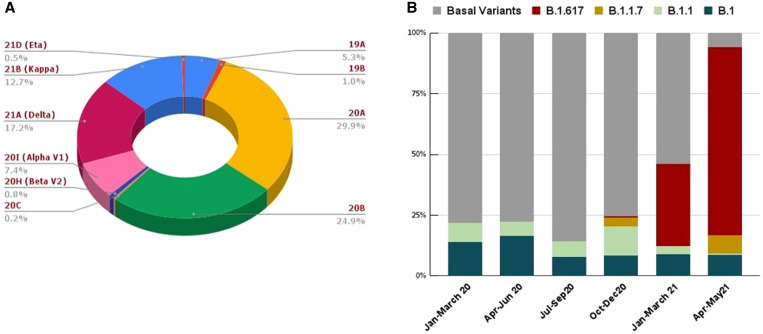
Figure 2.
(A) Overall distribution of severe acute respiratory syndrome coronavirus 2 (SARS-COV-2) clades according to Nextstrain classification. (B) Temporal distributions of the top five variants (represented in cumulative percentage) of SARS-COV-2 genomes. This figure appears in color at www.ajtmh.org.

