
Figure 5.
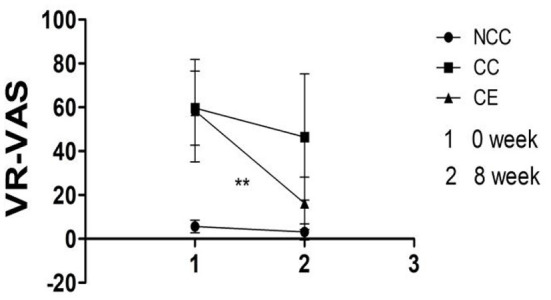
Comparison of VR-VAS scores pre-exercise and post-exercise (**p < 0.01, difference between 0 week and 8 week). 1,Week 0 is the score of VR-VAS; 2, Week 8 is the score of VR-VAS; VR-VAS, inducing cravings with cues measured by VR.
Official websites use .gov
A
.gov website belongs to an official
government organization in the United States.
Secure .gov websites use HTTPS
A lock (
) or https:// means you've safely
connected to the .gov website. Share sensitive
information only on official, secure websites.
Comparison of VR-VAS scores pre-exercise and post-exercise (**p < 0.01, difference between 0 week and 8 week). 1,Week 0 is the score of VR-VAS; 2, Week 8 is the score of VR-VAS; VR-VAS, inducing cravings with cues measured by VR.