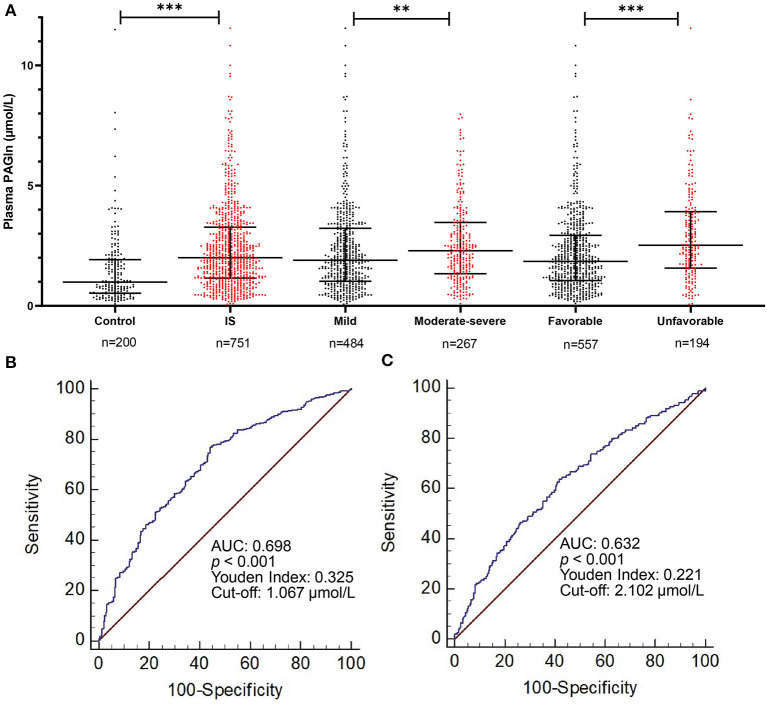
Figure 4.
Comparison of plasma PAGln levels between different subject groups. (A) PAGln levels in different groups: PAGln levels are higher in IS patients, IS patients with moderate-severe neurological function deficit, and patients with unfavorable short-term outcome (**p < 0.01, ***p < 0.001, Mann–Whitney U test). (B,C) ROC curves of PAGln levels in predicting IS patients from healthy controls and IS patients with unfavorable outcome from favorable outcome. PAGln, phenylacetylglutamine; IS, ischemic stroke; PAGln, phenylacetylglutamine; ROC, receiver operating characteristic curve; AUC, area under the curve.

