Figure 2.
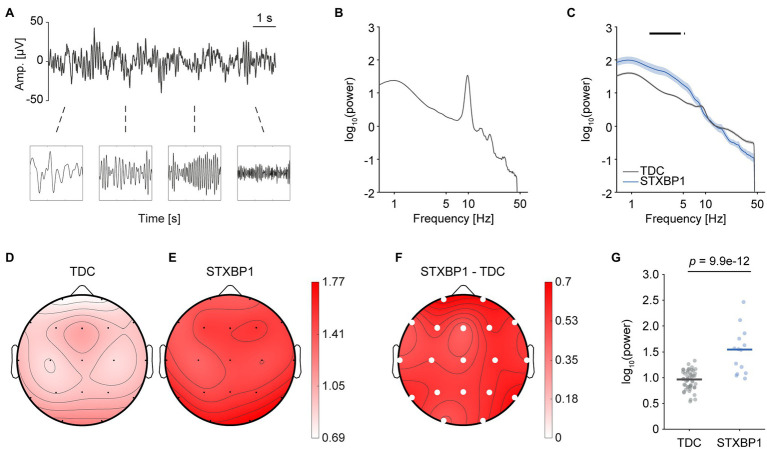
Higher low-frequency power in STXBP1 syndrome. (A) EEG records oscillations with power varying across frequency. (B) The power spectrum was computed using the Welch method with a Hamming window and a frequency resolution of 0.125 Hz. A typical example of a TDC with a clear 10-Hz alpha peak is shown. (C) Whole-brain average power spectrum of TDC and STXBP1 syndrome show higher power in the range 1.75–4.63 Hz in STXBP1 syndrome. ANCOVA was performed per frequency bin in the range 1–45 Hz and Bonferroni-corrected across the 353 frequency bins (, black bars). Shaded areas show standard error of the mean (SEM). (D–F) Scalp topography of power averaged across 1.75–4.63 Hz for TDC (D), STXBP1 syndrome (E) and STXBP1 syndrome minus TDC (F). Low-frequency power is higher in STXBP1 syndrome at all electrodes. Solid white circles: p-values of factor group of the ANCOVA with age as a covariate, Bonferroni-corrected by the number of electrodes, . (G) Whole-brain average power within the range 1.75–4.63 Hz was increased for STXBP1 syndrome.

