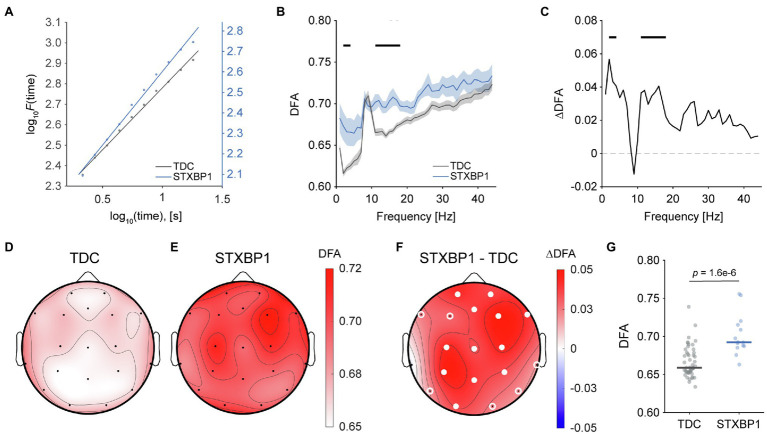
Figure 3.
Stronger long-range temporal correlations in STXBP1 syndrome. (A) The DFA exponent is the slope of the log–log linear fits shown, and was used to quantify long-range temporal correlations of brain oscillations. The fit is shown for a typical TDC and STXBP1 syndrome patient. The y-axis of the STXBP1 syndrome patient (blue axis) has been offset to highlight the difference in the DFA exponent compared with TDC. (B) DFA spectrum in the range 1–45 Hz shows higher DFA exponents for STXBP1 syndrome in the range 11–18 Hz, indicating stronger LRTC. Black bars: Bonferroni-corrected across frequencies, . Confidence intervals show SEM. The spectrum shows the average DFA exponent across subjects and electrodes. (C) DFA difference spectrum, computed as STXBP1 syndrome minus TDC. (D–F) Scalp topographies of DFA exponents averaged in the range 11–18 Hz for TDC (D), STXBP1 syndrome (E), and for STXBP1 syndrome minus TDC (F). DFA was higher for STXBP1 syndrome across the cortex. White circles indicate significance based on p-values of factor group of the ANCOVA with age as a covariate; open white-circles: p < 0.05; solid white circles: Bonferroni-corrected,. (G) Whole-brain average DFA in the range 11–18 Hz was higher for STXBP1 syndrome compared with TDC.

