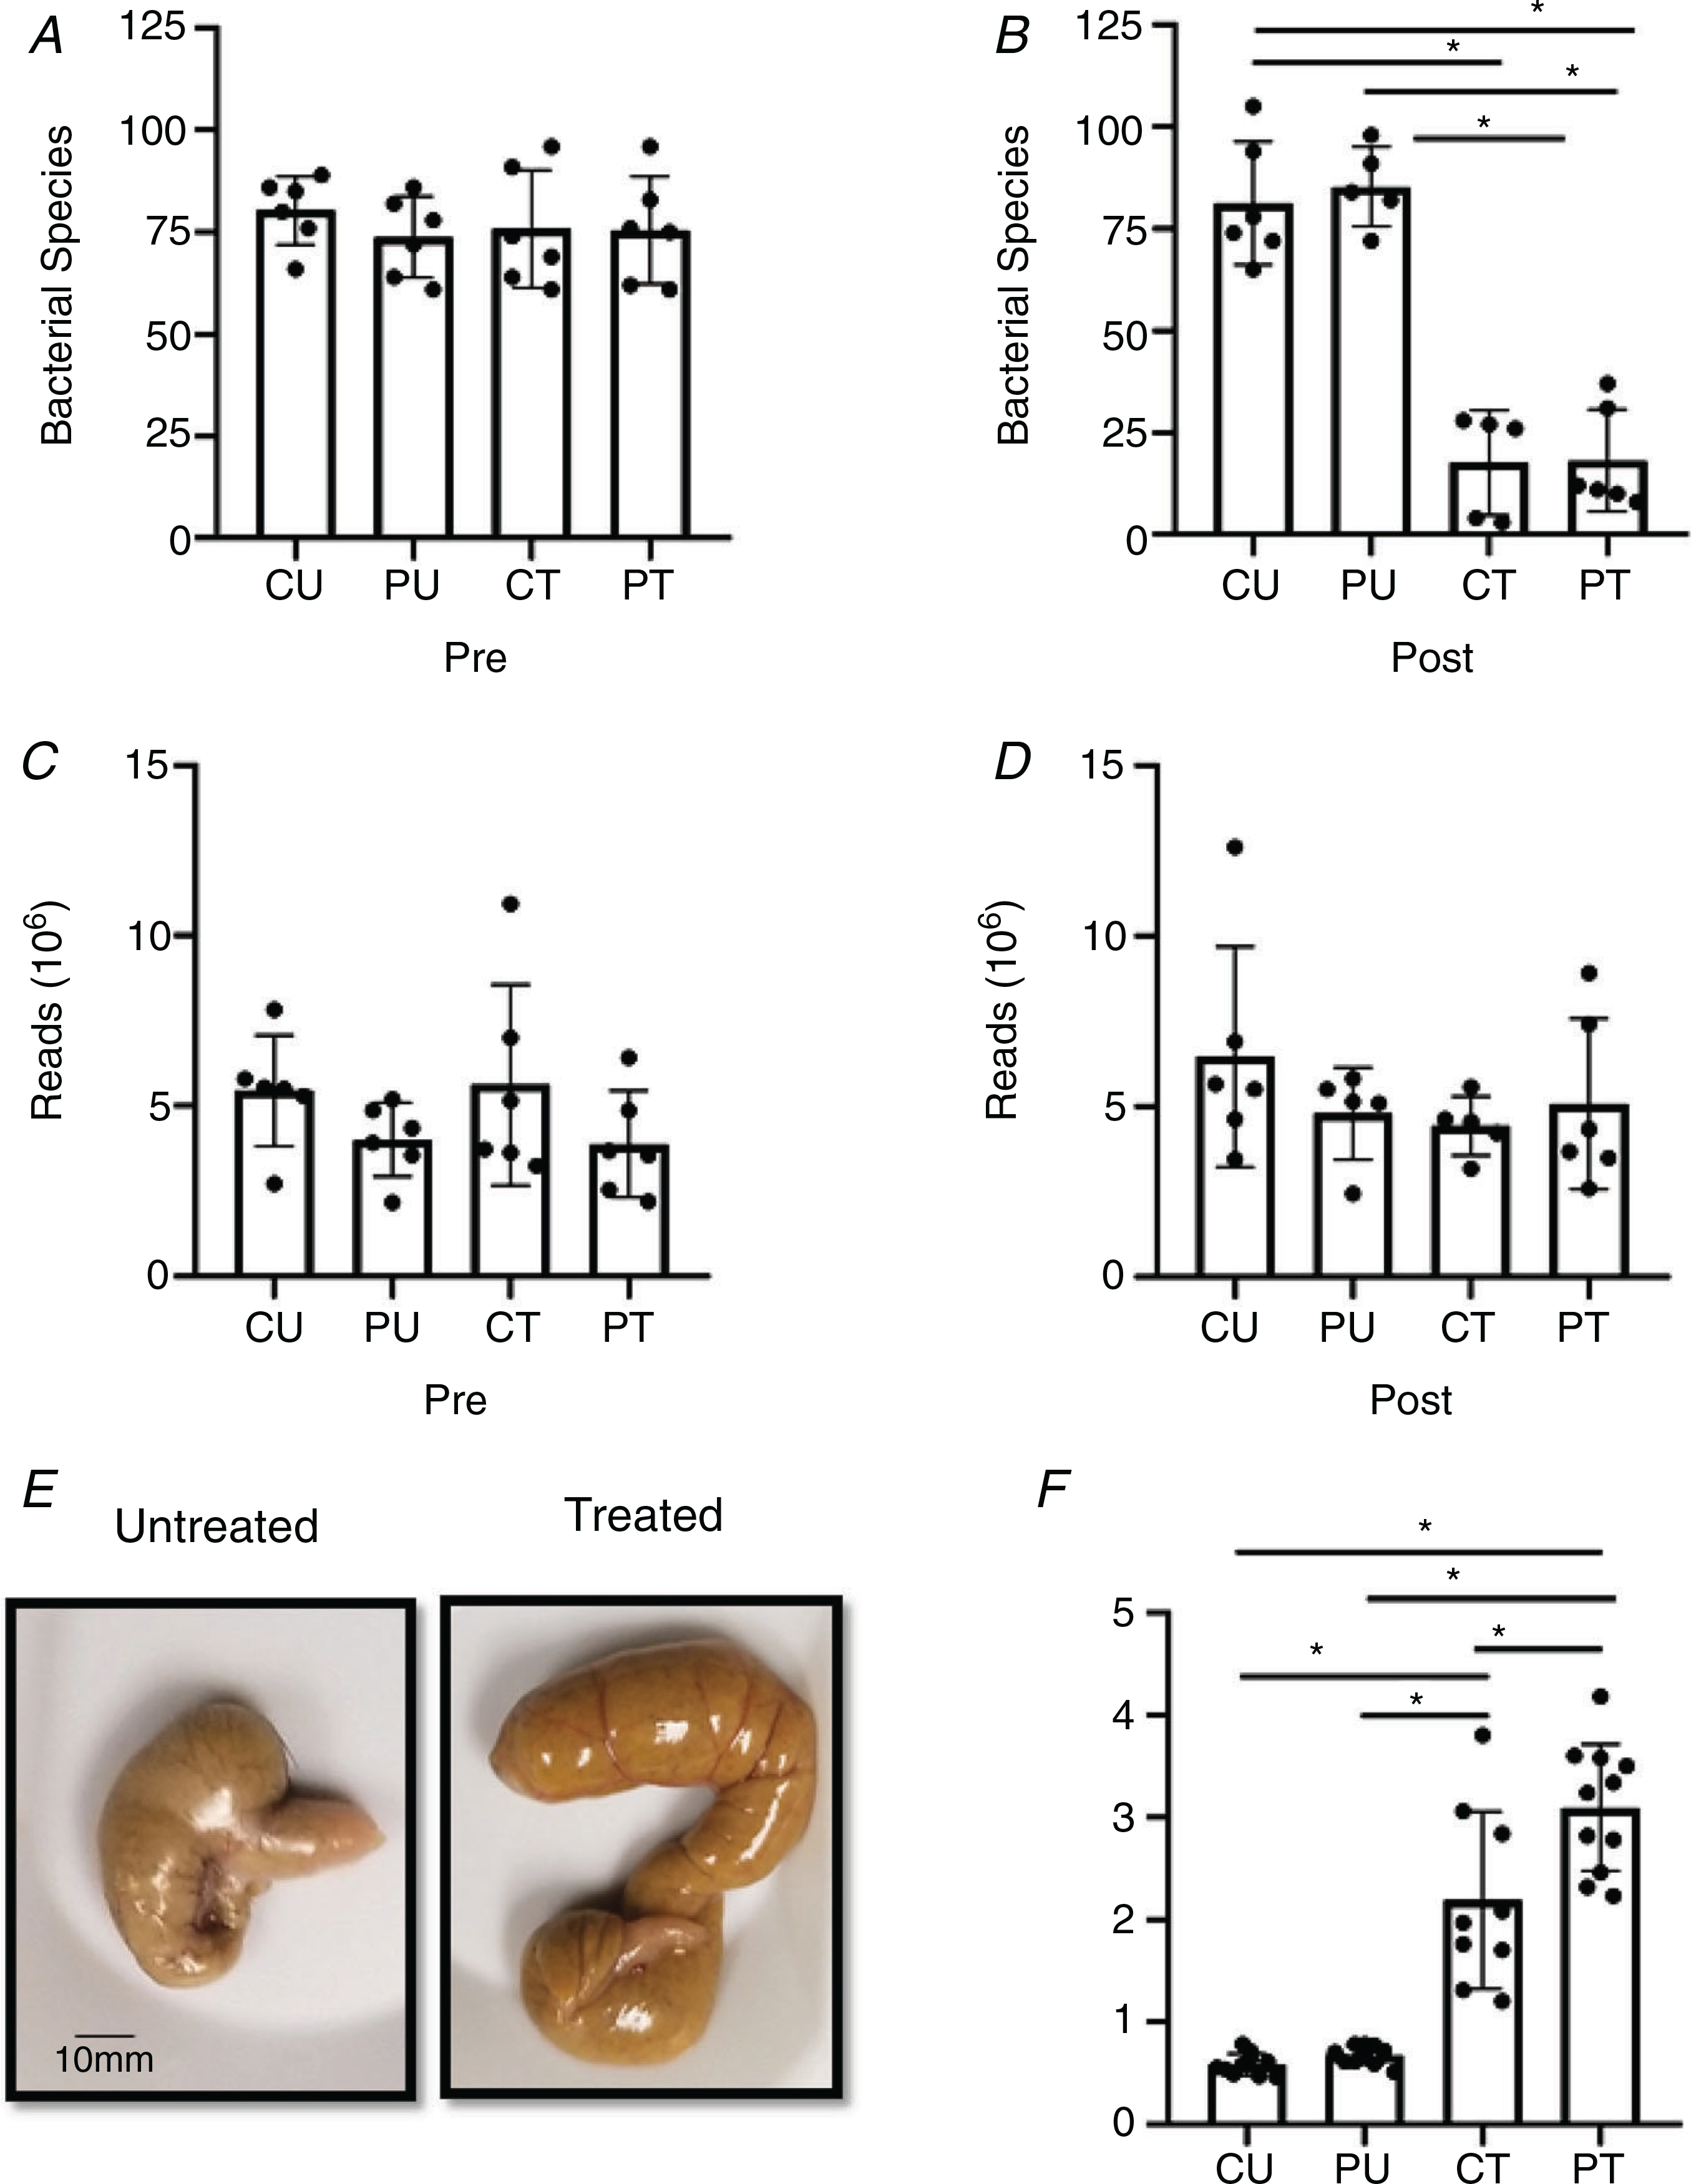
Figure 2. Gut microbial dysbiosis with antibiotics.

Antibiotic induced dysbiosis of the gut microbiome. A and B, number of individual bacterial species before (pre) (A) and after (post) (B) antibiotic treatment and PoWeR training n = 5–6 per group. C and D, number of reads during sequencing corresponding to the pre (C) and post (D) time points; n = 5–6 per group. E, representative image of a caecum harvested from an untreated and treated mouse. F, differences in caeca weight between the groups; n = 9–11 per group. Bars are mean values; circles represent individual values. Errors bars show standard deviation. *P < 0.05.
