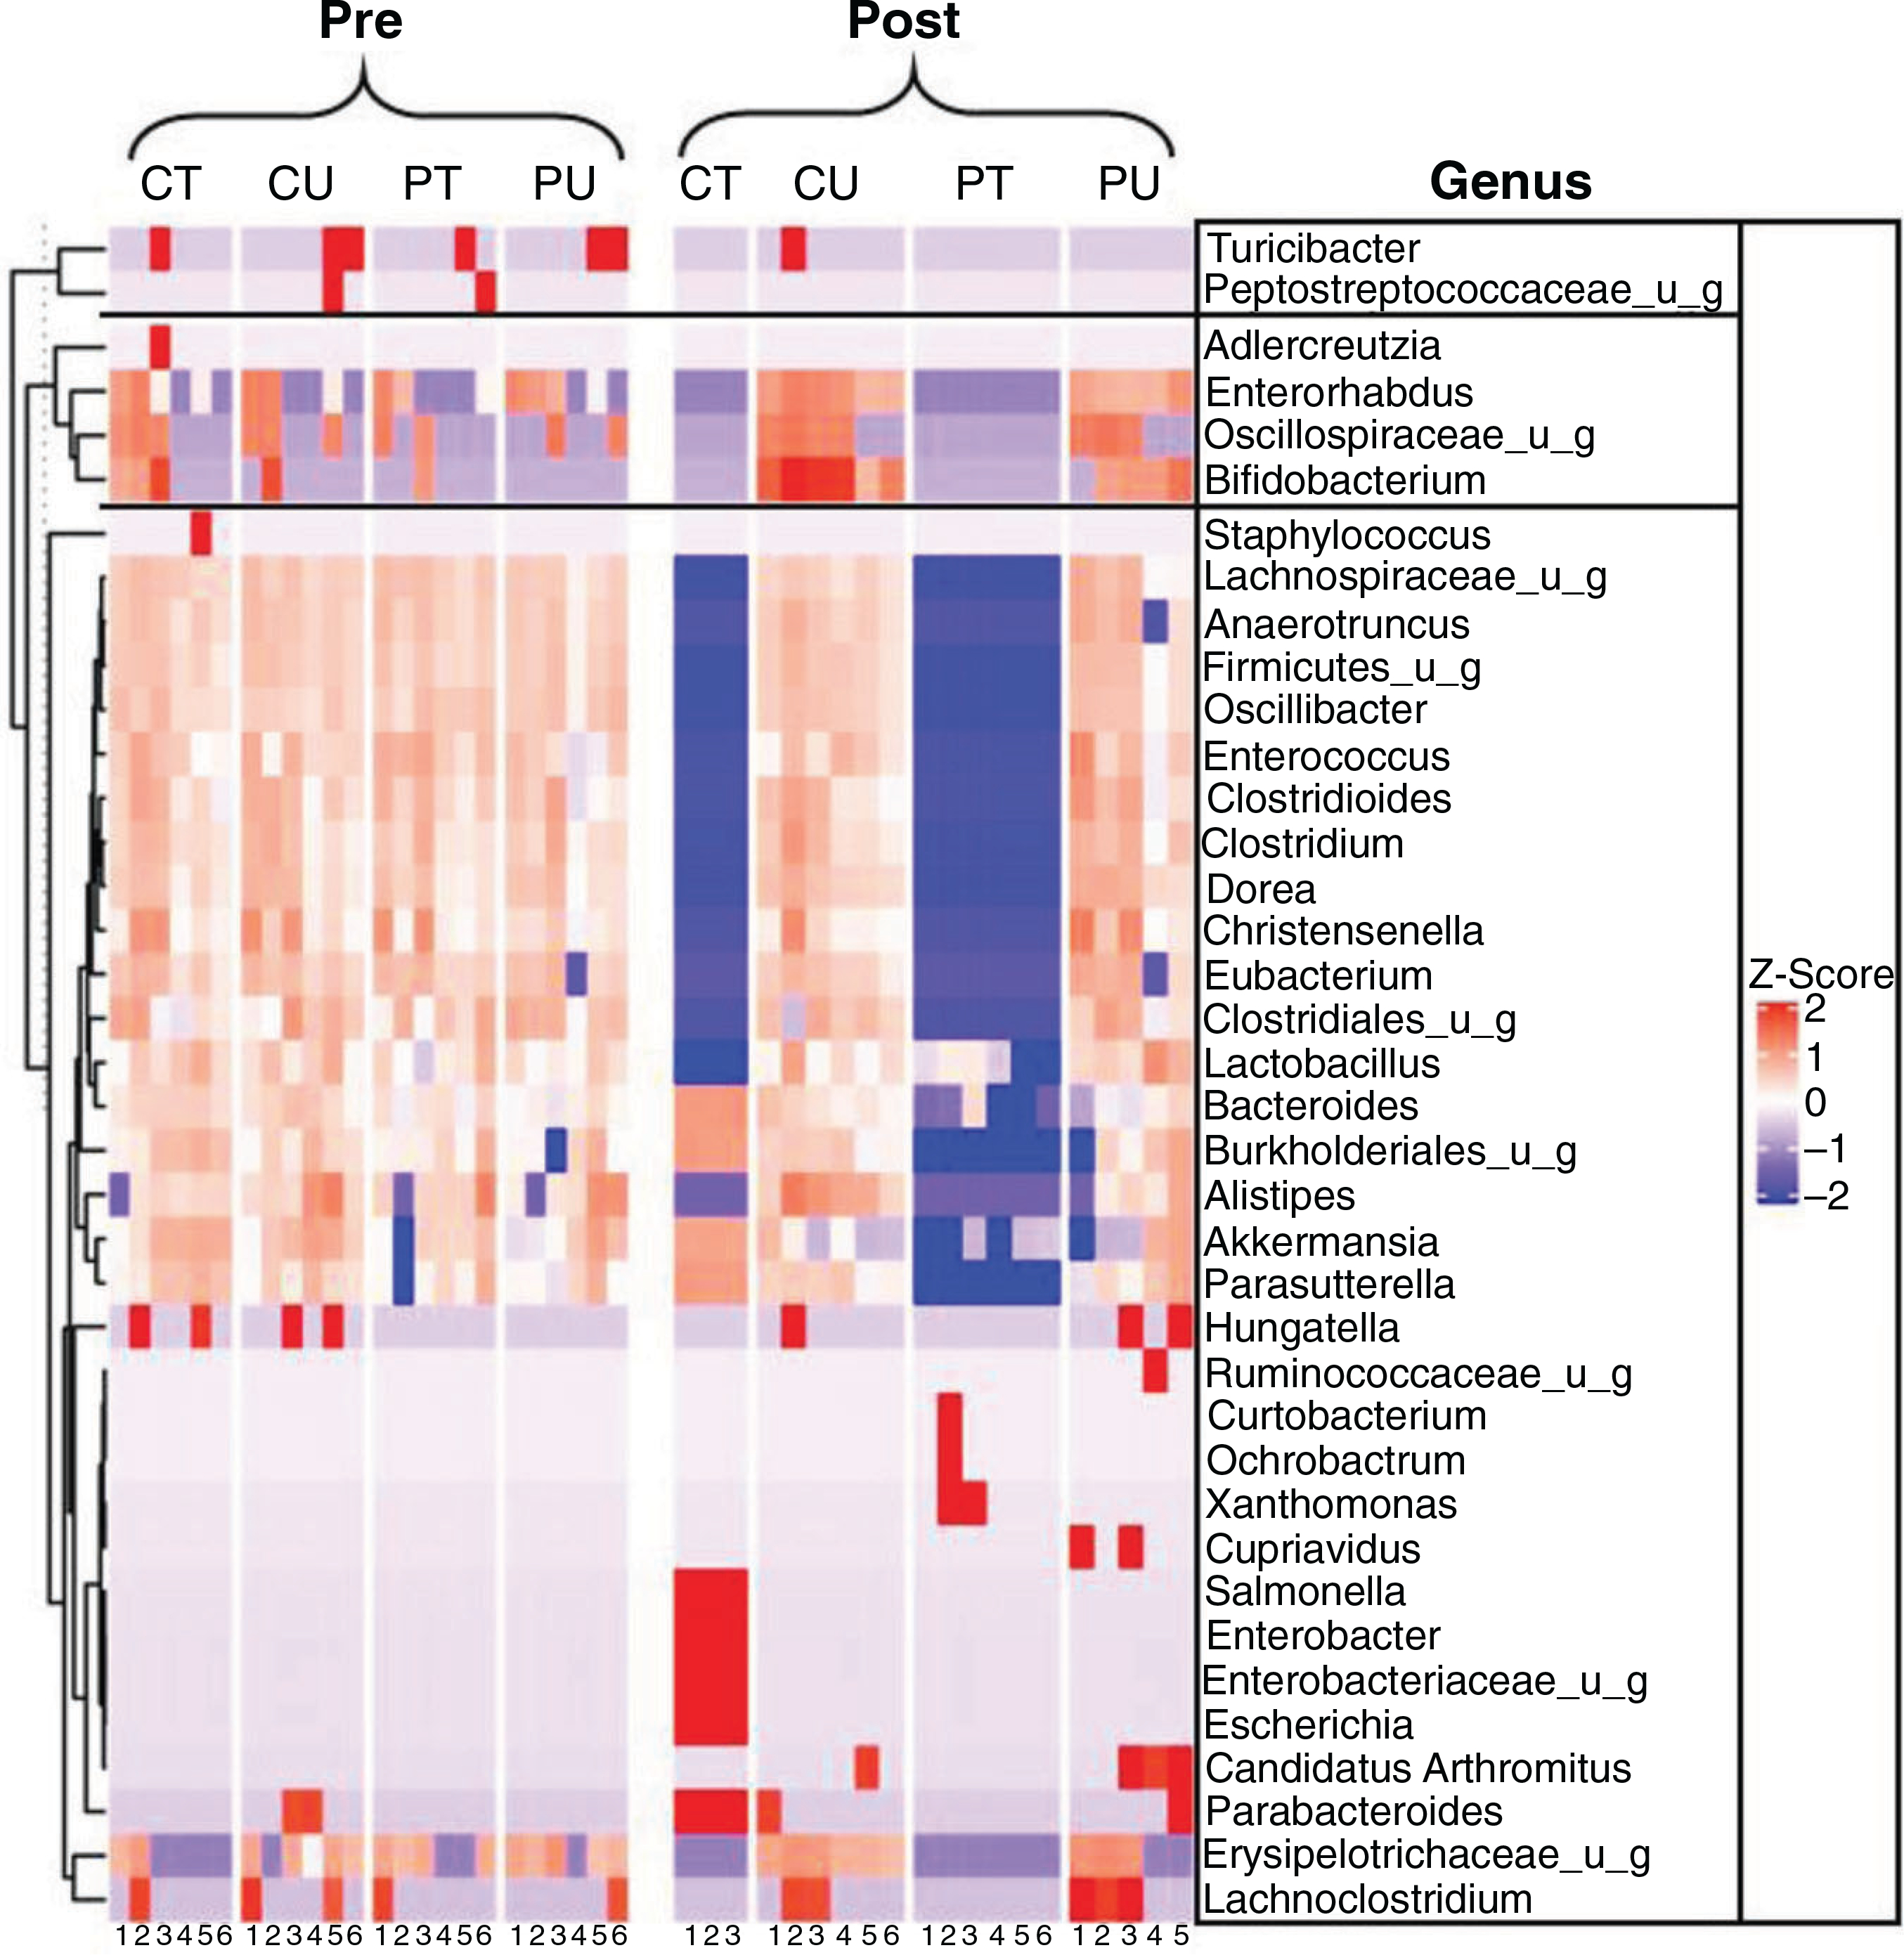
Figure 3. PoWeR- and antibiotic-induced changes to the microbiome composition.

Heat map indicating the microbial composition at the genus levels between groups at the pre and post time points. n = 3–6 per group.

Heat map indicating the microbial composition at the genus levels between groups at the pre and post time points. n = 3–6 per group.