Figure 2.
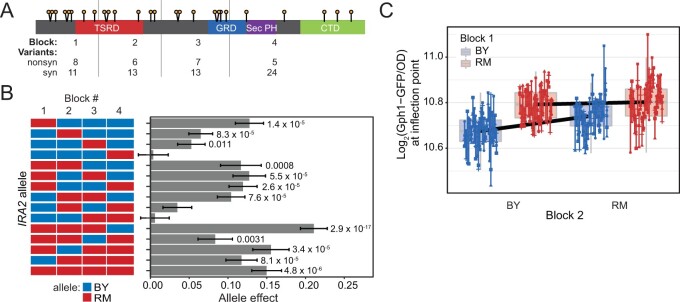
Effect of blocks of IRA2 variants on Gph1-GFP expression. (A) Schematic of Ira2 showing the nonsynonymous variants (lollipops), the block 1–4 junctions (grey vertical lines) and the number of nonsynonymous (nonsyn) and synonymous (syn) variants in each block. (B) Allele effect of each of the 16 block combinations. Each allele was represented by five or six transformants that were each phenotyped five times. The allele effect is the log2 of the average Gph1-GFP expression in the presence of the indicated allele minus that in the presence of the BY allele. Error bars are the standard error of the estimate. P-values are for a comparison between the given allele and the BY allele. Only significant values are displayed. P-values were not corrected for multiple testing. See Supplementary Table S7 for all P-values. (C) Epistasis between blocks 1 and 2. The figure shows residual Gph1-GFP expression after removal of random effects of plate and transformant identity (Materials and methods). Measurements are grouped by their alleles at blocks 1 and 2. The alleles of blocks 3 and 4 are any combination of BY or RM. The black lines connect the average allele effect for the indicated genotype. Epistasis is highlighted by the steeper slope of the line when block 1 is BY rather than RM.

