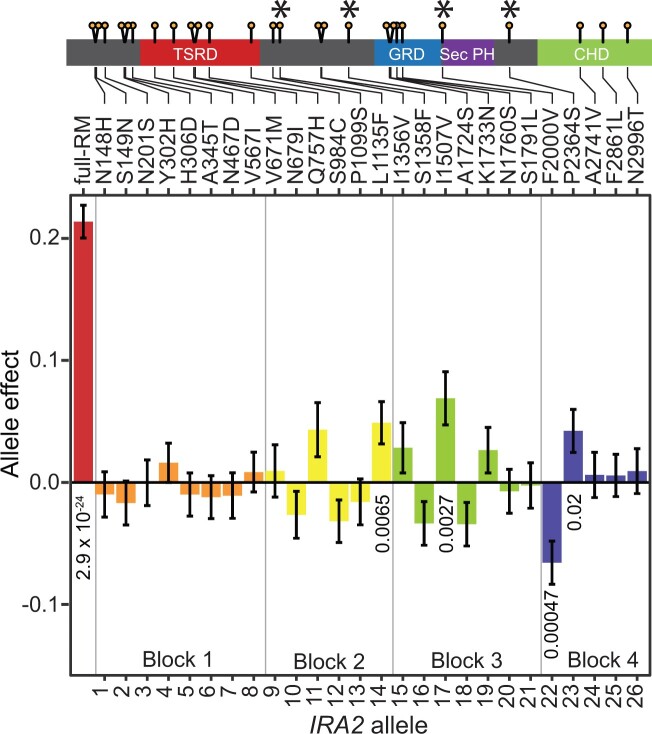
Figure 3.
Effect of each nonsynonymous RM variant in IRA2 on Gph1-GFP expression. Each allele was represented by nine transformants that were each measured five times. The first eight variants (N148H through V567I) were measured three additional times in an additional plate configuration. Significant P-values less than 0.05 for a comparison between the given allele and the BY allele are shown below the bars. These P-values were not corrected for multiple testing. See Supplementary Table S9 for all P-values. In the gene model, single variants with a significant effect are marked with an asterisk.

