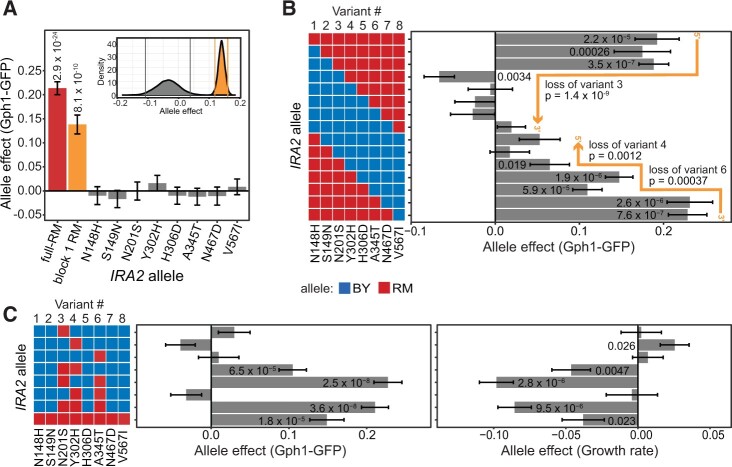
Figure 4.
Epistatic interactions between nonsynonymous variants in block 1. (A) Effects of each of the eight nonsynonymous RM variant alleles in block 1 and the block 1 RM and full-RM alleles. P-values are for a comparison between the given allele and the BY allele. Only significant P-values less than 0.05 are displayed. See Supplementary Table S11 for all P-values. Each allele was represented by 9 or 10 transformants that were each phenotyped three (block 1 RM) or eight (variants 1–8) times. Inset plot shows the bootstrap analysis of the effect of the block 1 RM allele compared to the summed effects of the eight variants in block 1. Same-color vertical lines mark the central 95% quantile range for each distribution. (B) Effect of progressive RM-to-BY allele replacement within block 1 on Gph1-GFP expression. Each allele was represented by five or six transformants, each measured five times. The P-values on the orange lines are for a comparison between the last allele to contain the indicated RM variant and the first allele without this RM variant. See Supplementary Tables S12 and S13 for all P-values. (D) Effect of all combinations of nonsynonymous RM variant alleles 3, 4, and 6 on Gph1-GFP expression (left panel) and growth rate (right panel), see Supplementary Tables S14 and S15, respectively, for all P-values. Each allele was represented by five transformants that were each measured eight times. (B,C) Significant differences (uncorrected P < 0.05) are shown for a comparison between the given allele and the BY allele. All P-values are available in Supplementary Tables S6 and S8, respectively.

