Figure 5.
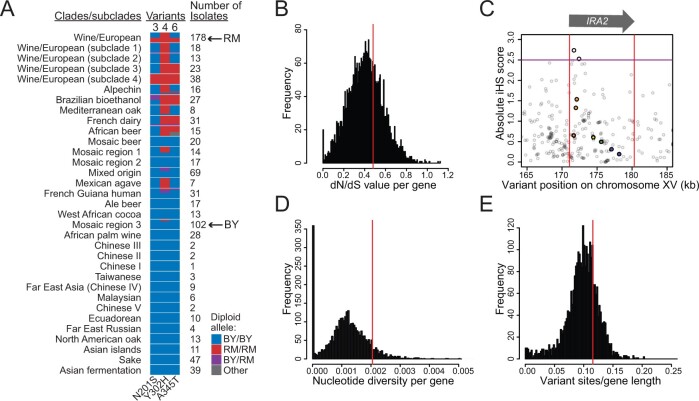
Population genetic analysis of IRA2. (A) Haplotypes formed by variants 3 (N201S), 4 (Y302H), and 6 (A345T). The clades and subclades are as defined in Peter et al. (2018) and are listed in order of relatedness. Clade/subclade haplotypes with greater than a 10% frequency are shown proportional to their frequency within each clade/subclade. (B,D,E) Distribution of population genetic parameter estimates for all yeast ORFs. IRA2 is indicated by vertical red lines. (C) Absolute iHS statistics centered on IRA2 (position indicated by the arrow and by red vertical lines), calculated in the clade of European wine strains. The seven causal variants identified here are indicated by larger colored dots. Two variants with iHS > 2.5 [purple line, following (Voight et al. 2006)] are indicated. These two variants segregate among wine strains, but do not differ between BY and RM. kb: thousand base pairs.

