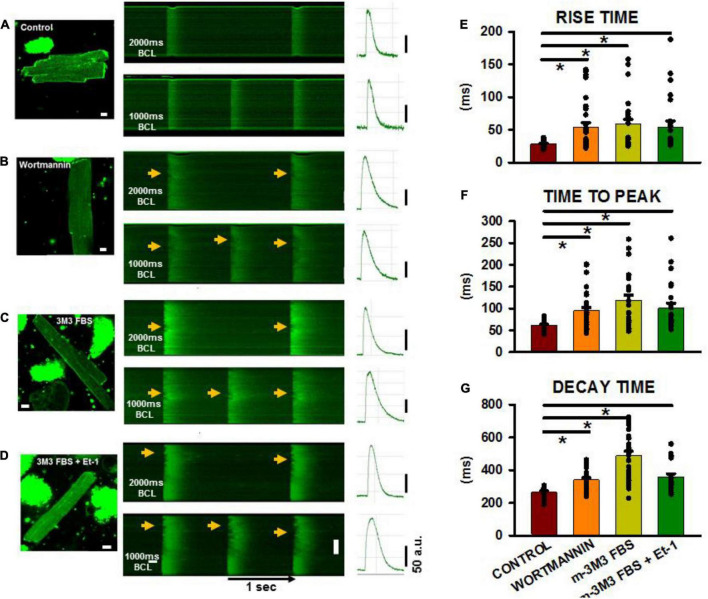
FIGURE 6.
Calcium transients in isolated adult ventricular myocytes after PIP2 depletion. (A–D) 2-D images with associated linescan images from treated and non-treated myocytes. Pacing was performed at basic cycle lengths of 2,000 and 1,000 ms. Arrows shows areas of delayed Ca2+ release along the cell length in the myocytes. (E–G) Shows summaries of rise time, time to peak and decay time from control and treated cells at a pacing cycle length of 1,000 ms. Control (n = 18–28 myocytes from 6 rats), wortmannin (27–36/5), m-3M3FBS (27/3), Et-1+m-3M3FBS (n = 22–24/3). *p < 0.05 using a Dunn’s test following a one-way ANOVA performed on cells. Pixel size was 0.2 μm with the pinhole adjusted to Airey units = 1.

