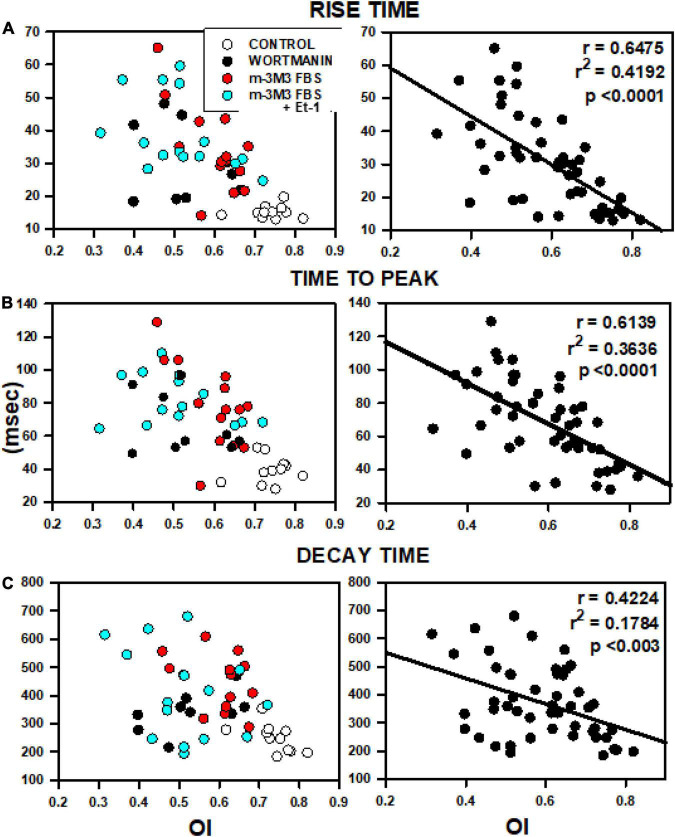
FIGURE 7.
Relationships between OI and rise time (A), time to peak (B) and decay time (C). Data were obtained from 5 rats from the analyses presented in Figure 6 including data from control myocytes (open circles), myocytes treated with wortmannin (filled circles), 3M3FBS (red circles) and combination Et-1 + 3M3FBS (cyan circles).

