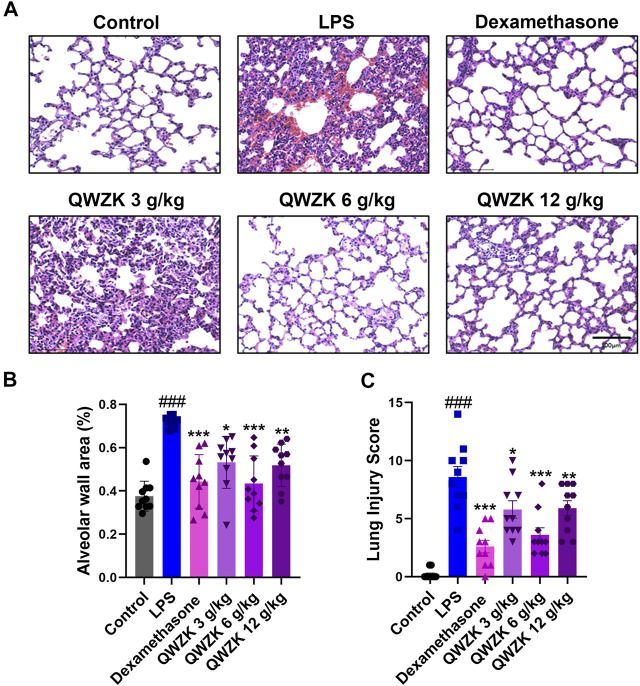
FIGURE 3.
QWZK alleviated the pathological characteristics of lung in ALI rats induced by LPS. (A) The images of lung in different groups, which was stained with H&E. Images are representatives of independent experiments. The scale bar in the figures represents a distance of 100 μm. (B) Statistical results of alveolar wall percentage in different groups. Data were presented as the mean ± SEM, n = 10. (C) Statistical results of lung injury score in different groups. Data were presented as the median ± SEM, n = 10. # p < 0.05 vs. control group, ## p < 0.01 vs. control group, ### p < 0.001 vs. control group. *p < 0.05 vs. LPS group, **p < 0.01 vs. LPS group, ***p < 0.001 vs. LPS group.

