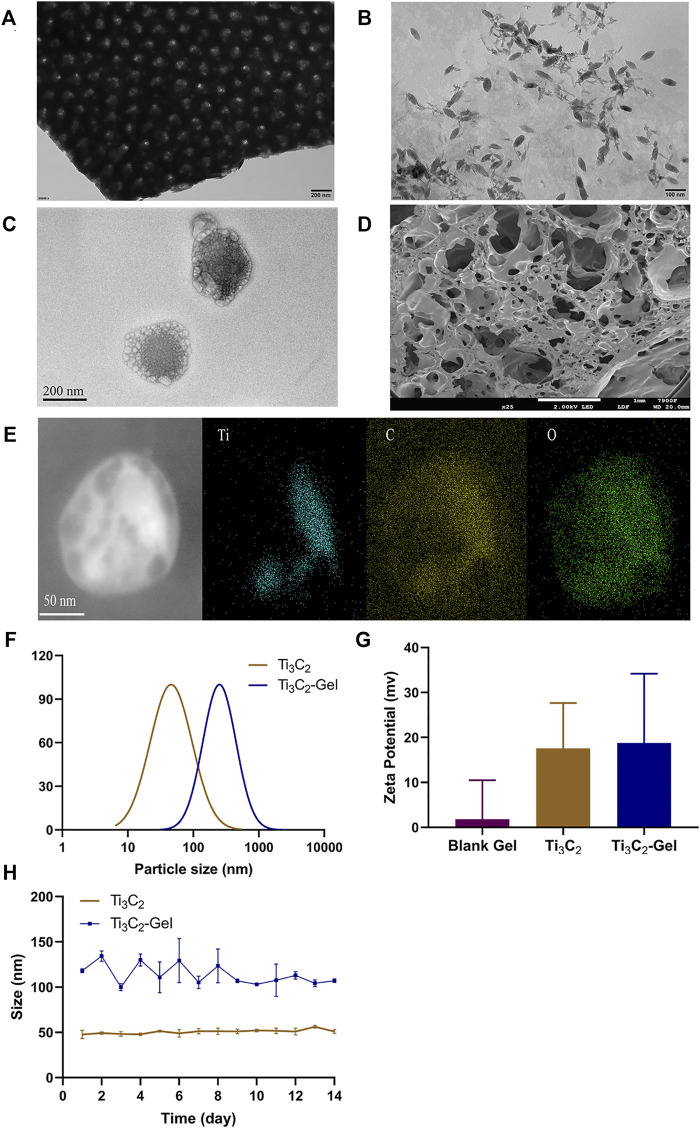
FIGURE 2.
Preparation and characterization of Ti3C2 nanoparticles and Ti3C2-Gel. Transmission electron microscopy image of (A) Ti3C2 MXene solution (scale bar: 200 nm), (B) Ti3C2 nanoparticles (scale bar: 100 nm), and (C) Ti3C2-Gel (scale bar: 200 nm). (D) Scanning electron microscopy image of Pluronic F-127 gel (scale bar: 1 mm). (E) Energy-dispersive X-ray image of Ti3C2-Gel (scale bar: 50 nm). (F) Particle sizes of Ti3C2 nanoparticles and Ti3C2-Gel. (G) Zeta potentials of the different preparations. (H) Stability of Ti3C2 and Ti3C2-Gel sizes.

