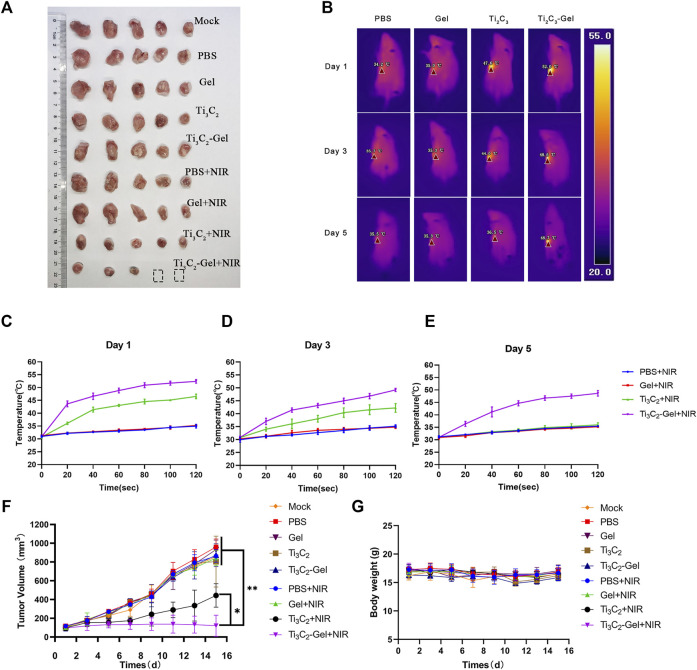
FIGURE 5.
In vivo antitumor performance. (A) Digital images of tumors of mice after treatment. (B) Thermal images of mice irradiated with an 808-nm laser. (C–E) Temperature in tumor-bearing mice recorded by a thermal imager under the 808-nm laser. (F) Growth curves of tumors in all mice after treatment. n = 5/group, mean ± SD, **p < 0.01. (G) Average body weight of mice in different groups.

