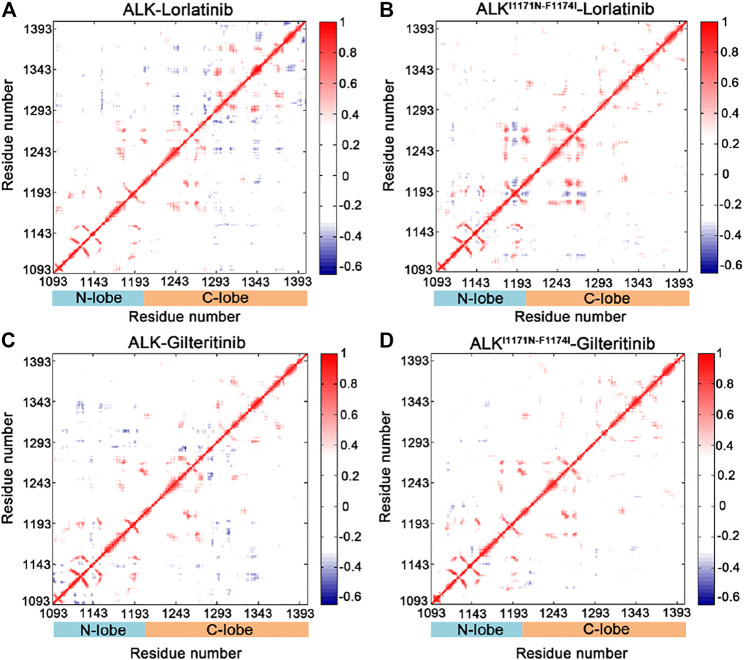
FIGURE 3.
Cross-correlation (CC ij ) matrix computed for the ALK–lorlatinib (A), ALKI1171N−F1174I–lorlatinib (B), ALK–gilteritinib (C), and ALKI1171N−F1174I–gilteritinib (D). The correlated motions are colored by red (CC ij > 0), while the anti-correlated motions are colored by blue (CC ij < 0). Color scales are shown at the right. The CC ij values with an absolute correlation coefficient of less than 0.3 are colored by white for clarity.

