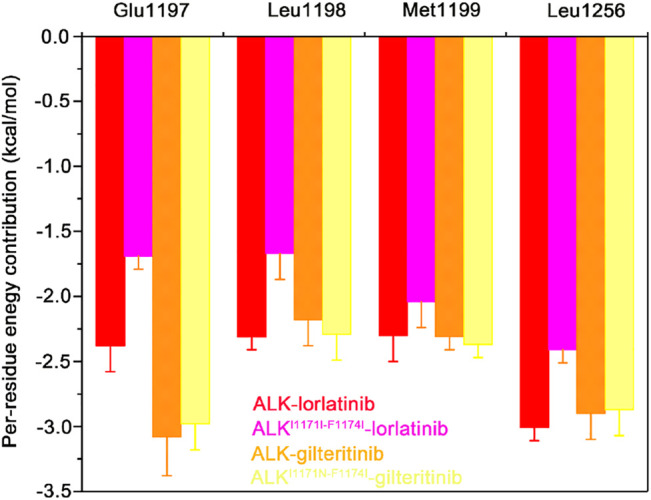
FIGURE 6.

The mainly distinct residue contributions to the binding affinities of lorlatinib/gilteritinib to both the wild-type and double mutant predicted by the MM-GBSA binding free energy decomposition. The error bars represent standard deviations of per-residue energetic contribution.
