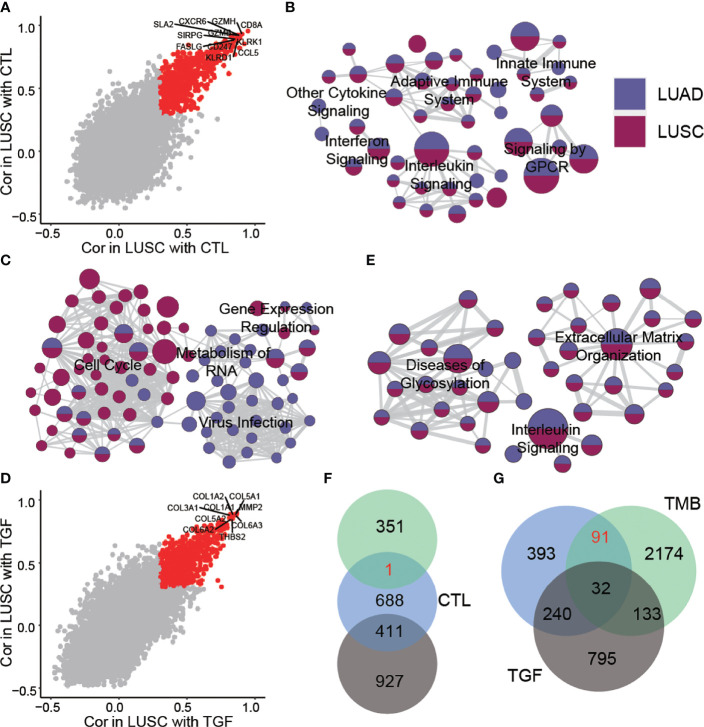
Figure 1.
Genes and pathways related to ICB treatment response biomarker. (A) Genes related to CTL in LUAD and LUSC. The red dots represent an association greater than 0.3 in two cancer types. (B) Pathways related to CTL in LUAD and LUSC. (C) Pathways related to TMB in LUAD and LUSC. (D) Genes related to TGF-β in LUAD and LUSC. The red dots represent an association greater than 0.3 in two cancer types. (E) Pathways related to TGF-β in LUAD and LUSC. (F) Relationship between genes related to CTL, TMB, and TGF-β in LUSC. (G) Relationship between genes related to CTL, TMB, and TGF-β in LUAD.

