
FIGURE 10.
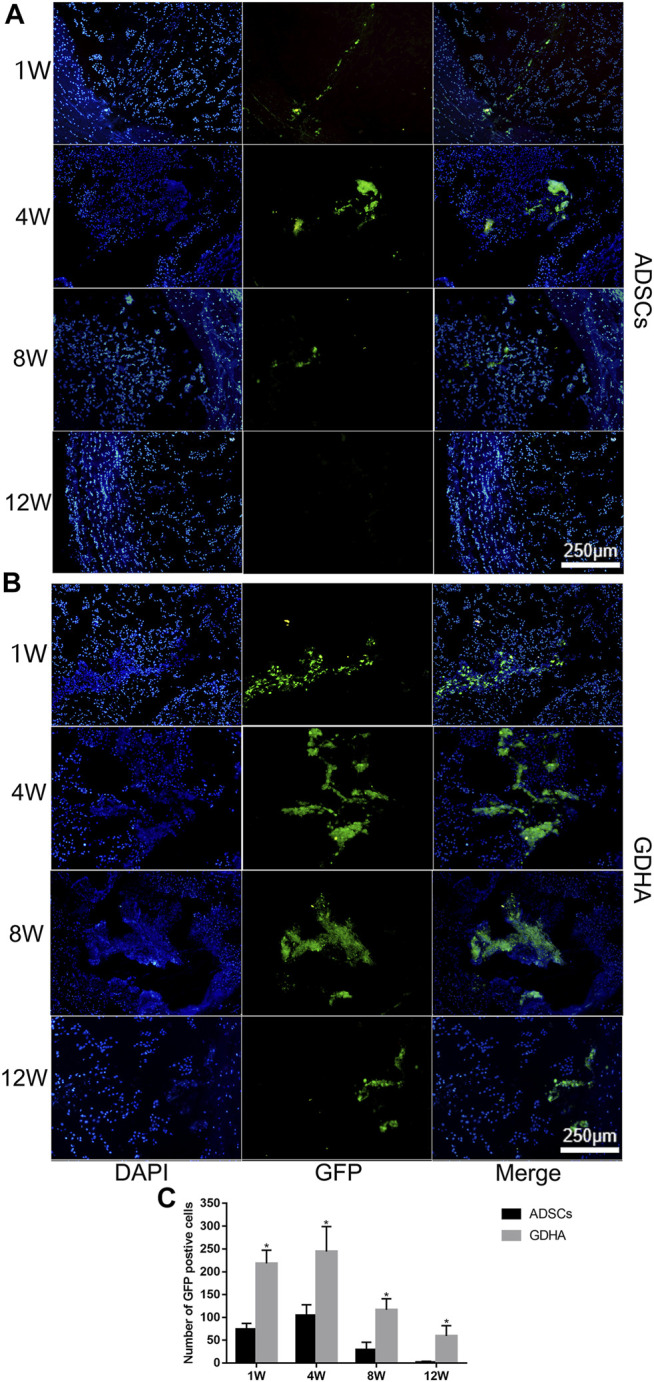
The survival and migration of ADSCs in the tail discs of the ADSC group (A) and GDHA group (B) at 1, 4, 8, and 12 weeks after injection. Data represented mean ± SD (n = 5); *p < 0.05, vs. sham group; # p < 0.05, vs. control group; & p < 0.05, vs. ADSC group; $ p < 0.05, vs. GHD group. Scale bar = 250 μm.