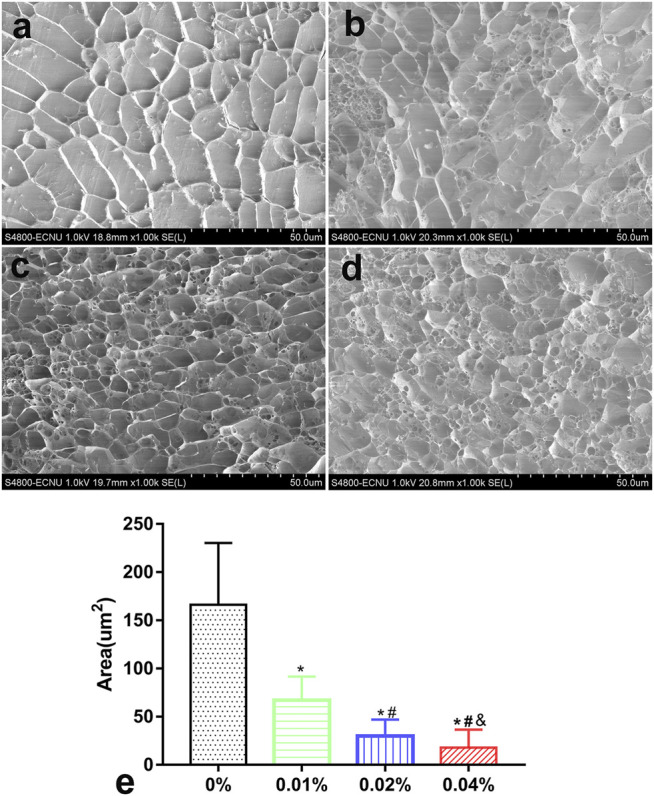
FIGURE 2.

The GHD microstructure observation and grid area measurement by a cryoelectron microscope. Cryoelectron microscope images of GHD in the (A) 0%, (B) 0.01%, (C) 0.02%, and (D) 0.04% groups. (E) The quantification of the average grid area of GHD cross-linked with genipin. Data represented mean ± SD (n = 5); *p < 0.05, vs. 0% group; # p < 0.05, vs. 0.1% group; & p < 0.05, vs. 0.02% group.
