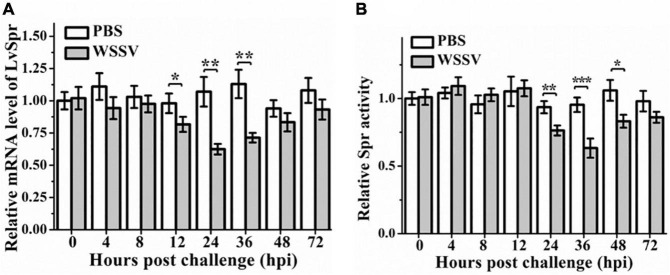
FIGURE 3.
The expression profiles (A) and enzymatic activity (B) of LvSpr in hemocytes of L. vannamei post-challenge with WSSV. Hemocyte samples were collected at 0, 4, 8, 12, 24, 36, 48, and 72 h from shrimp challenged with 50 μL PBS containing 1.0 × 10⁶ copies of WSSV or 50 μL PBS as a control. Bars represented the mean ± SE (n = 3) from three experiments. The expression of LvSpr in hemocytes at 0 h of PBS challenged shrimp was set as 1.0. Asterisks indicate statistically significant differences of mRNA levels between the WSSV group and the corresponding PBS control group (*p < 0.05, **p < 0.01, ***p < 0.001).

