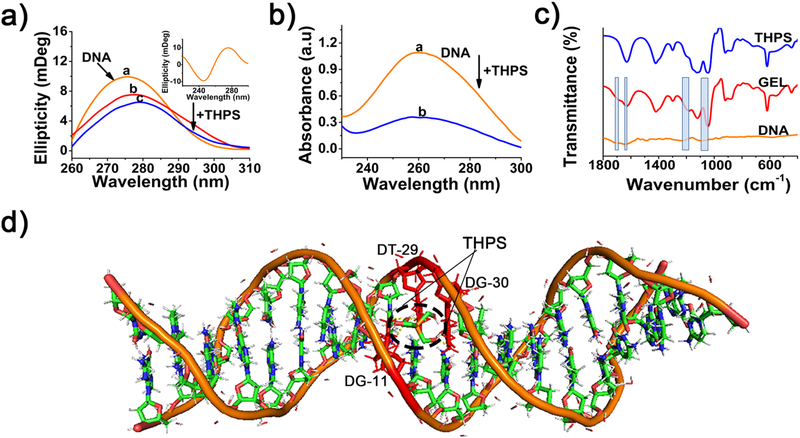
Figure 2.
a) CD spectra of DNA and DNA-THPS complex, different concentration of THPS mixed with DNA, from curves a to care corresponding to 0, 10, 50 mg mL−1 and concentration of DNA is 0.5 wt%. b) UV-vis absorption spectra of DNA and DNA-THPS complex, a and b are DNA and DNA-THPS, respectively. DNA concentration is 0.05 wt% and THPS concentration is 10 mg mL−1. c) FTIR spectra of the freeze-dried DNA solution, DNT hydrogel and THPS solution, the width of rectangles stands for the shift of wavenumbers. d) Molecular Docking simulation of the binding site between DNA and THPS.

