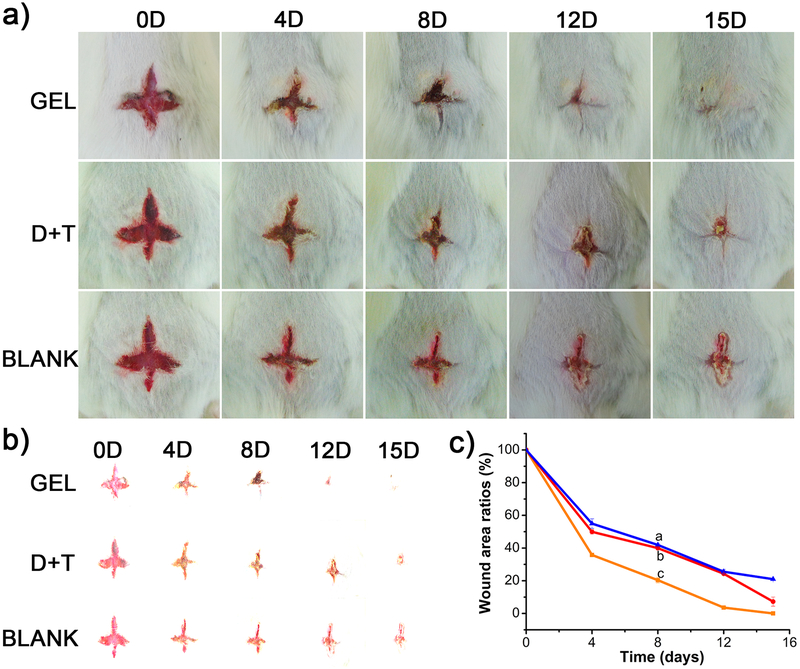
Figure 6.
a) Photographs of the wounds treated with hydrogels, (D+T) mixture and nontreated at 0, 4, 8, 12 and 15 days respectively. b) Separation image of the wound area. c) The wound area was measured by Image Pro Plus and the plot of wound area ratio, from curve a to c, BLANK, (D+T) mixture, DNT hydrogel.

