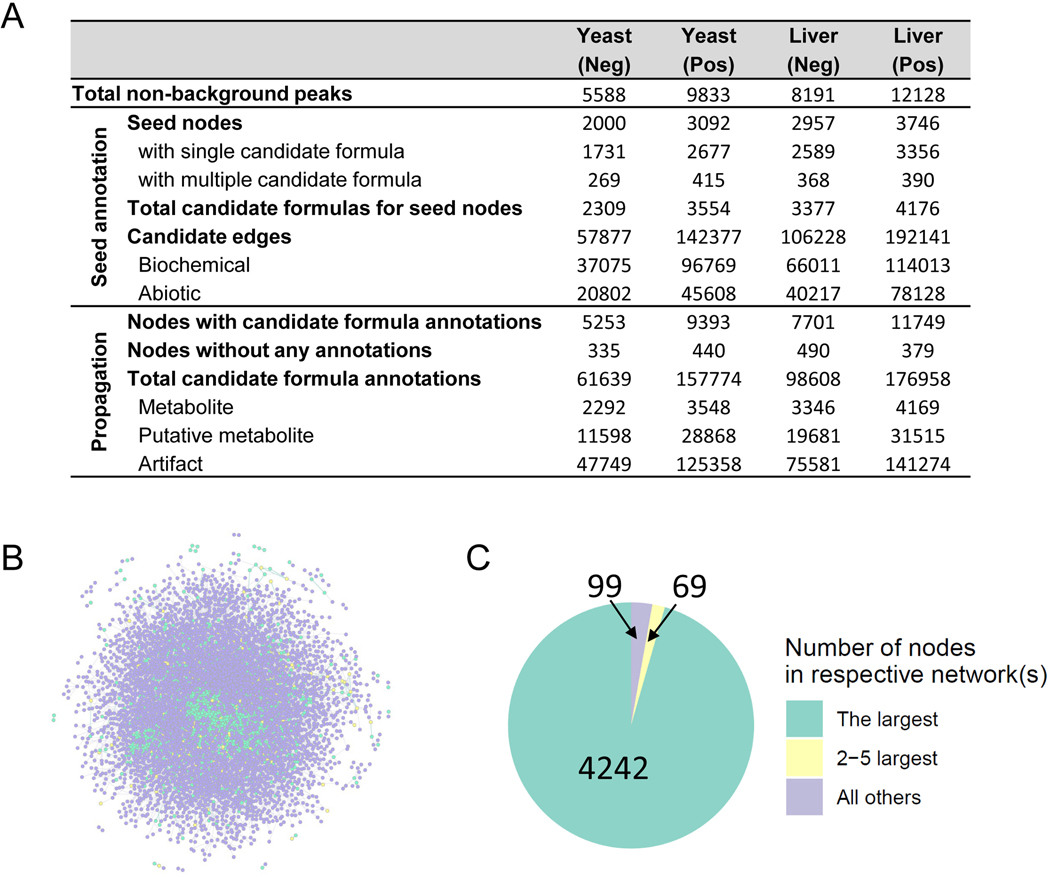
Extended Data Fig. 1. Characterization of NetID network.
Characterization of NetID network. (A) Summary table of the candidate annotation step in NetID workflow. (B) Visualization of the optimal network obtained from negative mode LC-MS analysis of Baker’s yeast, containing 4851 nodes and 9699 connections. Metabolite and putative metabolite peaks are in green and artifact peaks in purple. (C) Connectivity of NetID network from the yeast negative-mode dataset.

