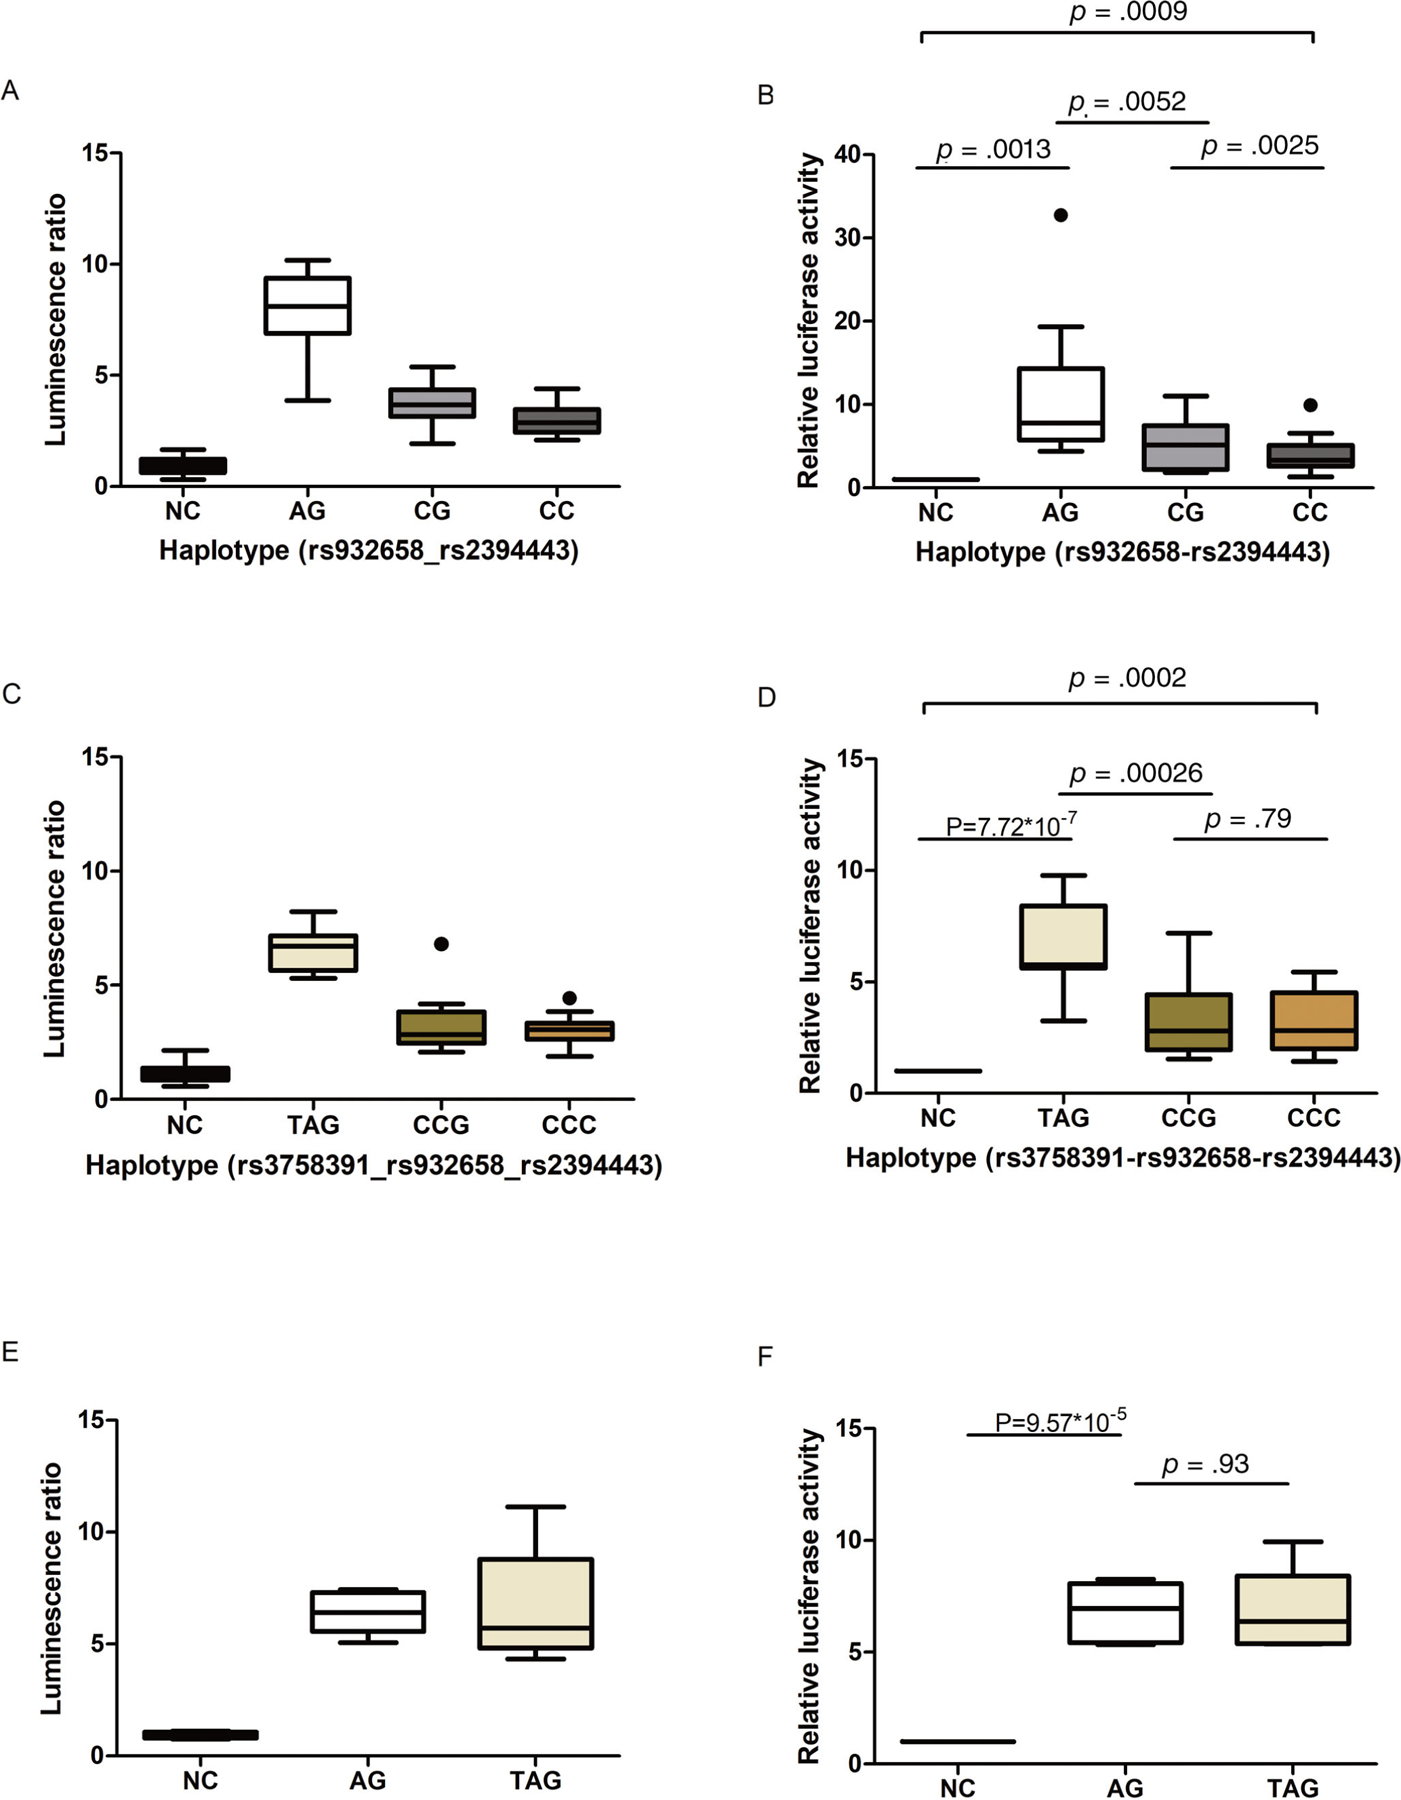
Fig 4.

The effect of different haplotypes in luciferase reporter assays. Luminescence activity for different haplotypes is shown in a relative luminescence activity plot. (A, C, E) Luminescence ratio is represented by the ratio of the firefly luciferase activity and Renilla luciferase activity. (B, D, F) Box plots of the normalized ratios of the luminescence ratios, which normalized the results from each experimental sample to control samples repeated on each plate. (A–D) Polymorphism A of rs932658 increased promoter activity of SIRT1. rs2394443 did not affect promoter activity significantly. (E, F) There was no significant difference between haplotype A-G and haplotype T-A-G. Box plot key: line within box = median; upper boundary of box = third quartile (Q3); lower boundary of box = first quartile (Q1); vertical length of box = interquartile range (IQR); upper whisker = smaller value of the maximum and Q3 + 1.5*IQR; lower whisker = larger value of the minimum and Q1–1.5*IQR. Dots indicate outliers outside of the boundaries defined by whiskers.
