Fig. 17.

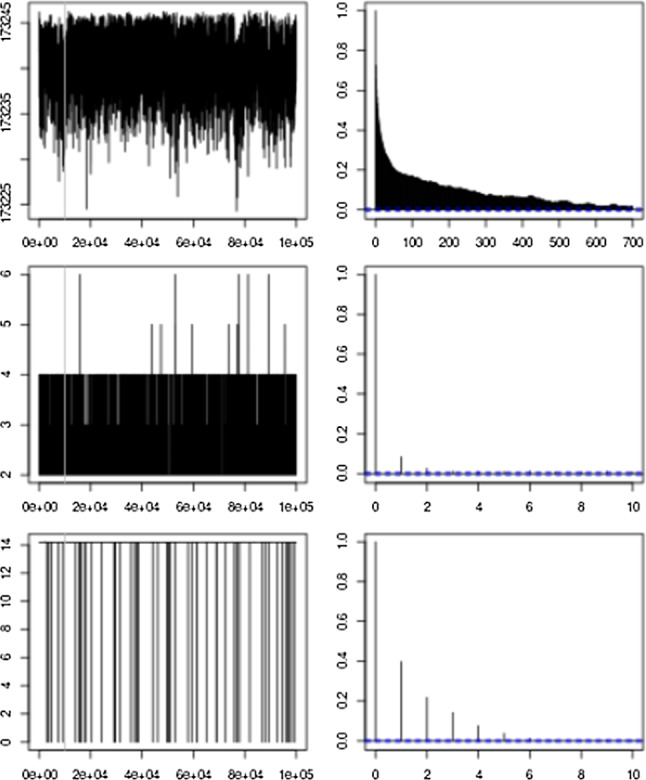
Trace plot and autocorrelation plot for the log-posterior density, number of CTMC jumps and time of the first change in the IF, respectively, for scenario A5 in Sect. 4.1

Trace plot and autocorrelation plot for the log-posterior density, number of CTMC jumps and time of the first change in the IF, respectively, for scenario A5 in Sect. 4.1