
Fig. 7.
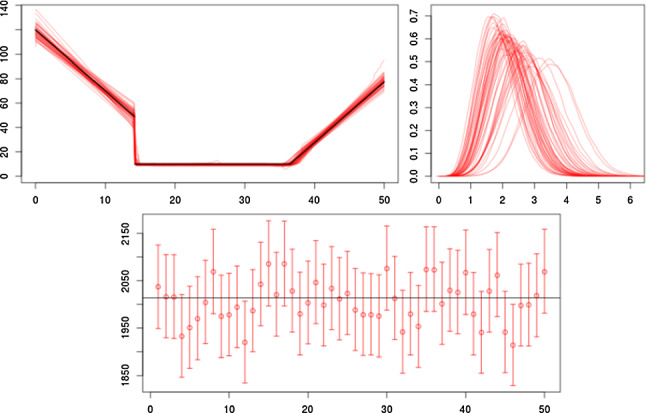
Results for 50 replications of scenario A3. Top left: true (black line) and posterior mean of the IF for each replication. Top right: posterior density of the measure of fit in (17) for each replication. Bottom: mean and 95% CI for the integrated IF for each replication. Horizontal line represents the real value