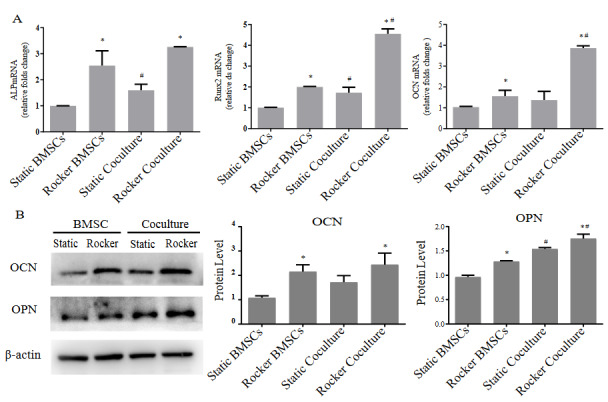
Figure 3.

Osteogenic gene expression and osteogenic marker protein expression of monoculture and coculture with or without 2h/day FSS stimulation. (A) Expression of osteogenesis-related genes on day 7. (B) Expression of osteogenesis-related proteins on day 7. Compared with static group, * p < 0.05; compared with monocultured BMSCs, # p < 0.05. n = 3.
