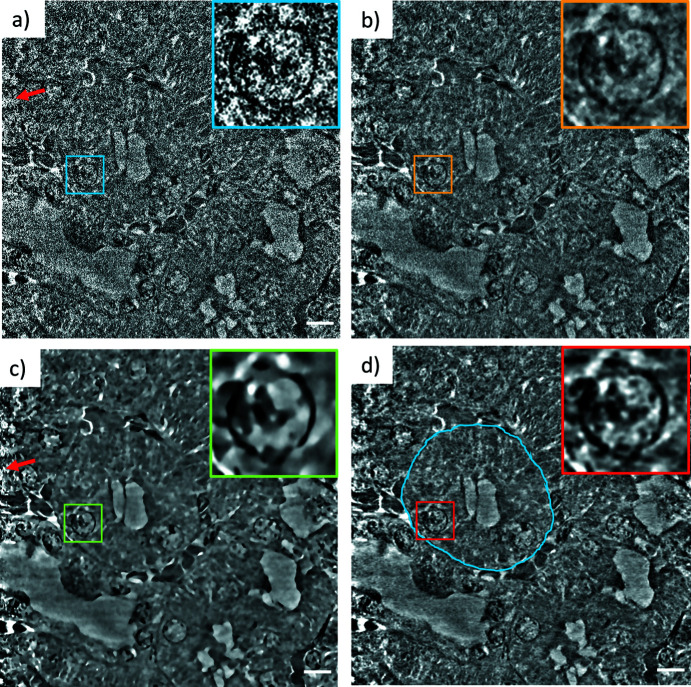
Figure 7.
ROI tomography of a mouse kidney in a yz view for (a) the unfiltered reconstruction, (b) the median 3D filter, (c) the NLM filter and (d) ML applied. The insets show the magnified nucleus of a cell. The blue outline shows a kidney tubular structure. Noise increases at the edges of the image, as indicated by the red arrows. The scale bars are 5 µm.

