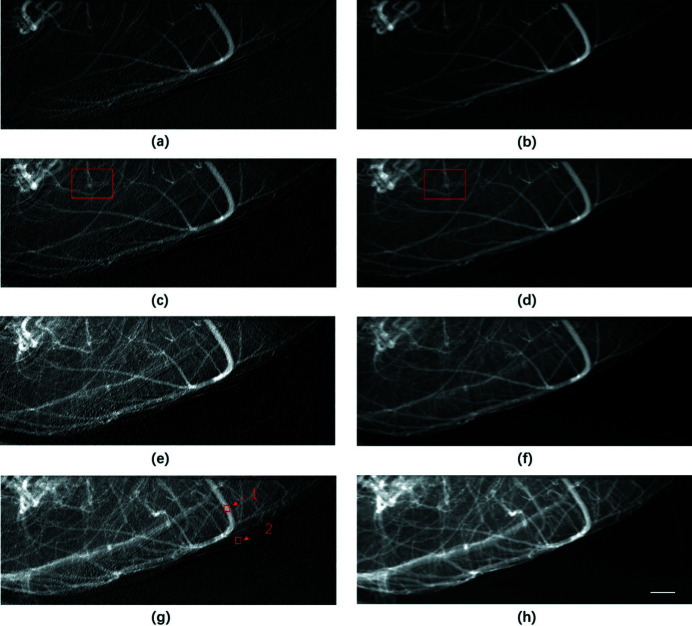
Figure 3.
Perfusion process of contrast agent in mouse cerebral blood vessels, where (a), (c), (e), and (g) are images of the perfusion process at different phases obtained using the traditional temporal subtraction method, whereas (b), (d), (f), and (h) are the counterpart images obtained using PTA. Scale bar: 1 mm.

