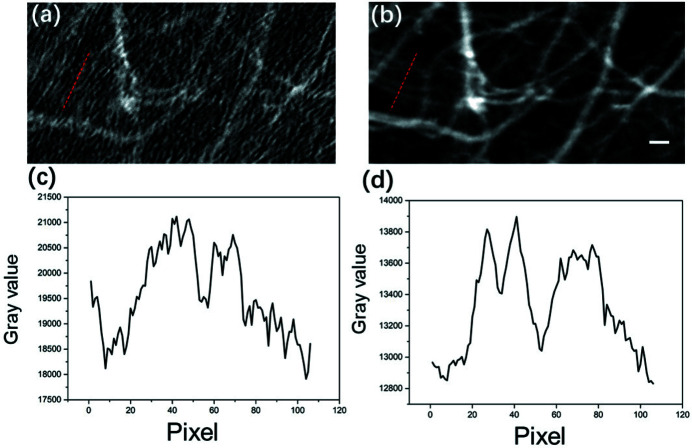
Figure 4.
Magnified view of microvessels reconstructed using the temporal subtraction method and PTA, where (a) and (b) are the areas denoted with a red box in Figs. 3 ▸(c) and 3(d), respectively. Panels (c) and (d) are corresponding line profiles at the positions marked by the red dashed lines in (a) and (b). Scale bar: 200 µm.

